File:Monthly U.S. dry shale natural gas production in January 2008 through June 2021 (51416355242).png
跳至導覽
跳至搜尋

預覽大小:800 × 403 像素。 其他解析度:320 × 161 像素 | 640 × 323 像素 | 1,143 × 576 像素。
原始檔案 (1,143 × 576 像素,檔案大小:122 KB,MIME 類型:image/png)
說明
說明
添加單行說明來描述出檔案所代表的內容
摘要
[編輯].png&action=edit§ion=1)
| 描述 |
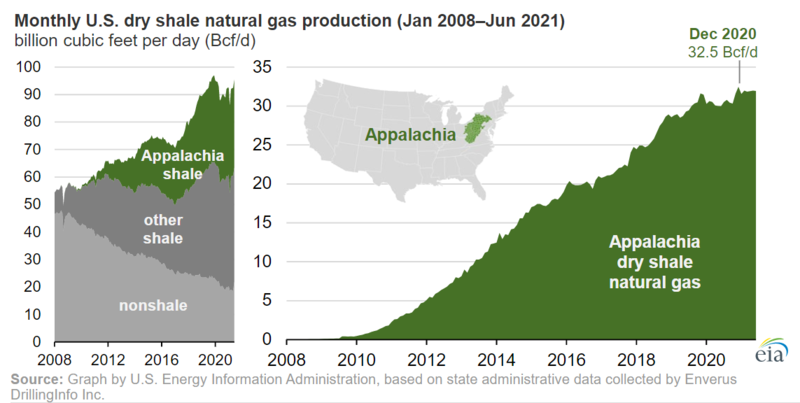
Dry natural gas production from shale formations in the Appalachian Basin that spans Pennsylvania, West Virginia, and Ohio has been growing since 2008, and monthly production has recently set new record highs. <a href="https://www.eia.gov/todayinenergy/detail.php?id=49377" rel="noreferrer nofollow">www.eia.gov/todayinenergy/detail.php?id=49377</a> September 1, 2021 |
| 日期 | |
| 來源 | Monthly U.S. dry shale natural gas production in January 2008 through June 2021 |
| 作者 | U.S. Energy Information Administration |
授權條款
[編輯].png&action=edit§ion=2)
| 此圖像是美國能源部(或前身組織)的僱員於其公務中所作之作品。由於此作品由美國聯邦政府所作,其處於公有領域。
請注意美國國家實驗室使用不同授權條款而其中部分為自由條款。檢查實驗室的網站政策後才可使用此標籤。
|

|
| 這幅圖片原始出處為Flickr的https://flickr.com/photos/124982865@N08/51416355242 ,作者為U.S. Energy Information Administration 。經機器人FlickreviewR 2在2021年9月18日審查後確定為採用United States Government Work的協議授權使用。 |
檔案歷史
點選日期/時間以檢視該時間的檔案版本。
| 日期/時間 | 縮圖 | 尺寸 | 使用者 | 備註 | |
|---|---|---|---|---|---|
| 目前 | 2021年9月18日 (六) 17:57 | | 1,143 × 576(122 KB) | MarginalCost(留言 | 貢獻) | Transferred from Flickr via #flickr2commons |
無法覆蓋此檔案。
檔案用途
沒有使用此檔案的頁面。
全域檔案使用狀況
以下其他 wiki 使用了這個檔案:
- ar.wikipedia.org 的使用狀況
- en.wikipedia.org 的使用狀況
- zh.wikipedia.org 的使用狀況
.png&oldid=879093748)