File:Monthly global increase of methane.png
Jump to navigation
Jump to search
Size of this preview: 800 × 497 pixels. Other resolutions: 320 × 199 pixels | 640 × 397 pixels | 897 × 557 pixels.
Original file (897 × 557 pixels, file size: 51 KB, MIME type: image/png)
Captions
Captions
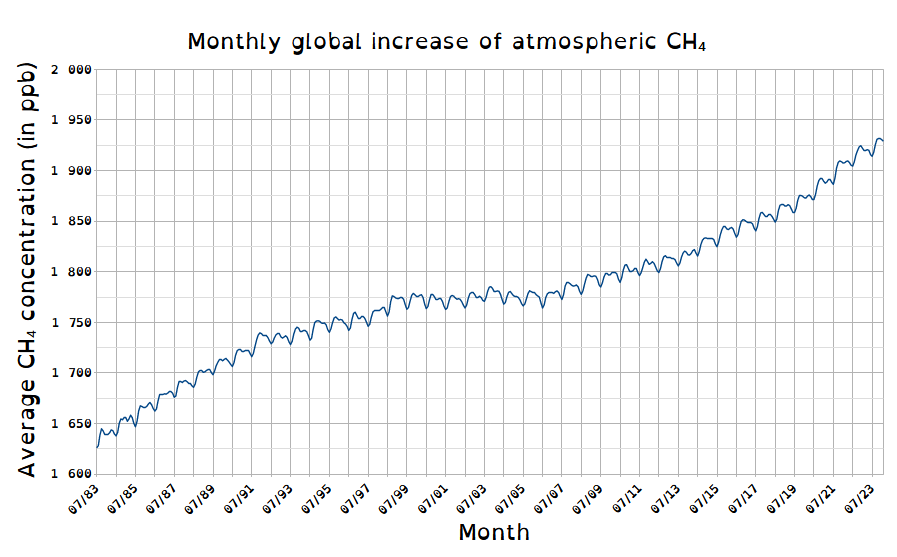
Graph of methane concentration in the Earth atmosphere
Summary
[edit]
| Description |
English: Graph of the global average concentration in methane in the Earth atmosphere every month, between July 1983 and February 2024. Data determined from marine surface sites.
"ppb" means parts per billion. "CH₄" is the chemical formula for methane. |
| Date | |
| Source |
Own work, data from Lan, X., K.W. Thoning, and E.J. Dlugokencky: Trends in globally-averaged CH4, N2O, and SF6 determined from NOAA Global Monitoring Laboratory measurements. Version 2024-06, https://doi.org/10.15138/P8XG-AA10 Font used is OpenDyslexic. |
| Author | Yaqub Qomarudin Dibiazah |
| Other versions |
 |
Licensing
[edit]
I, the copyright holder of this work, hereby publish it under the following license:
| This file is made available under the Creative Commons CC0 1.0 Universal Public Domain Dedication. | |
| The person who associated a work with this deed has dedicated the work to the public domain by waiving all of their rights to the work worldwide under copyright law, including all related and neighboring rights, to the extent allowed by law. You can copy, modify, distribute and perform the work, even for commercial purposes, all without asking permission.
|

|
This media file is uncategorized.
Please help improve this media file by adding it to one or more categories, so it may be associated with related media files (how?), and so that it can be more easily found.
Please notify the uploader with {{subst:Please link images|File:Monthly global increase of methane.png}} ~~~~ |
File history
Click on a date/time to view the file as it appeared at that time.
| Date/Time | Thumbnail | Dimensions | User | Comment | |
|---|---|---|---|---|---|
| current | 14:38, 7 July 2024 | | 897 × 557 (51 KB) | Yaqub Qomarudin Dibiazah (talk | contribs) | Uploaded own work with UploadWizard |
You cannot overwrite this file.
File usage on Commons
The following page uses this file: