File:North Atlantic Tropical Cyclone Activity 1949–2015 Power Dissipation Index PDI NOAA EPA.png

Original file (928 × 580 pixels, file size: 65 KB, MIME type: image/png)
Captions
Captions
Summary
[edit]
| Description |
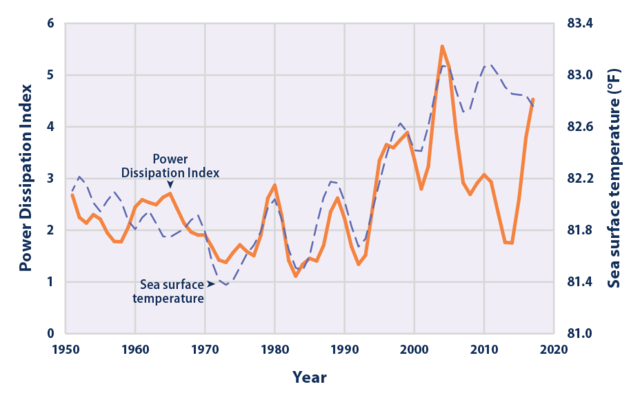
English: North Atlantic Tropical Cyclone Activity According to the Power Dissipation Index, 1949–2015
This figure presents annual values of the Power Dissipation Index (PDI), which accounts for cyclone strength, duration, and frequency. Tropical North Atlantic sea surface temperature trends are provided for reference. Note that sea surface temperature is measured in different units, but the values have been plotted alongside the PDI to show how they compare. The lines have been smoothed using a five-year weighted average, plotted at the middle year. The most recent average (2011–2015) is plotted at 2013. Data source: Emanuel, K.A. 2016 update to data originally published in: Emanuel, K.A. 2007. Environmental factors affecting tropical cyclone power dissipation. J. Climate 20(22):5497–5509. |
| Date | |
| Source | https://www.epa.gov/climate-indicators/climate-change-indicators-tropical-cyclone-activity#6 |
| Author | EPA/NOAA |
Licensing
[edit]
This image is in the public domain because it contains materials that originally came from the U.S. National Oceanic and Atmospheric Administration, taken or made as part of an employee's official duties.
|
File history
Click on a date/time to view the file as it appeared at that time.
| Date/Time | Thumbnail | Dimensions | User | Comment | |
|---|---|---|---|---|---|
| current | 11:43, 2 September 2022 | | 928 × 580 (65 KB) | Adakiko (talk | contribs) | Current power disipation plotted to 2017 |
| 11:35, 2 September 2022 |  | 928 × 580 (83 KB) | Adakiko (talk | contribs) | Current 1880 to 2021 | |
| 14:51, 8 October 2017 |  | 928 × 580 (67 KB) | Prokaryotes (talk | contribs) | User created page with UploadWizard |
You cannot overwrite this file.
File usage on Commons
There are no pages that use this file.
File usage on other wikis
The following other wikis use this file:
- Usage on bn.wikipedia.org
- Usage on en.wikipedia.org
- Usage on ko.wikipedia.org
- Usage on zh.wikipedia.org