File:Suicide rates in G20 countries.svg
(Redirected from File:Oecd-suicide.svg)

Size of this PNG preview of this SVG file: 800 × 533 pixels. Other resolutions: 320 × 213 pixels | 640 × 427 pixels | 1,024 × 683 pixels | 1,280 × 853 pixels | 2,560 × 1,707 pixels | 1,080 × 720 pixels.
Original file (SVG file, nominally 1,080 × 720 pixels, file size: 208 KB)
Captions
Captions
Add a one-line explanation of what this file represents

|
This file may be updated to reflect new information. If you wish to use a specific version of the file without new updates being mirrored, please upload the required version as a separate file. |
Summary[edit]
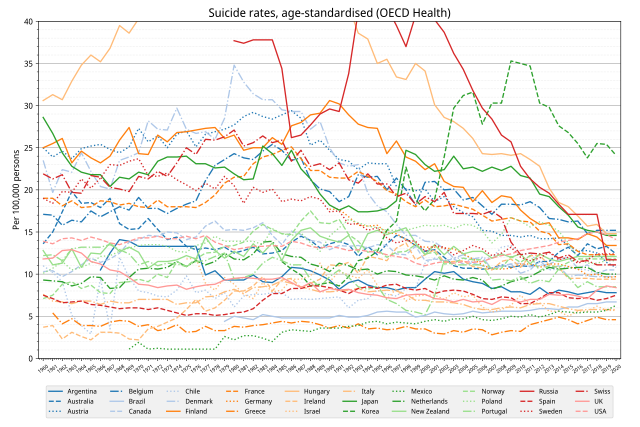
| Description | Suecide rates, selected G20 countries. |
| Date | |
| Source |
Own work, Data from OECD Health Statistics http://www.oecd.org/health/health-statistics.htm |
| Author | Yuasan |
| Permission (Reusing this file) |
CC-0 |
Licensing[edit]
I, the copyright holder of this work, hereby publish it under the following license:
| This file is made available under the Creative Commons CC0 1.0 Universal Public Domain Dedication. | |
| The person who associated a work with this deed has dedicated the work to the public domain by waiving all of their rights to the work worldwide under copyright law, including all related and neighboring rights, to the extent allowed by law. You can copy, modify, distribute and perform the work, even for commercial purposes, all without asking permission.
|
graph data[edit]
import numpy as np
import matplotlib.pyplot as plt
from cycler import cycler
import pandas as pd

df = pd.read_csv("data.tsv", index_col=0 , sep = "\t")
df = df.T
df = df.fillna(method = 'ffill')

fig, ax = plt.subplots(figsize=(12, 8))
plt.rcParams['font.family'] = 'sans-serif'
plt.rcParams['font.sans-serif'] = ['Noto Sans Display']
plt.rcParams["axes.prop_cycle"] = plt.cycler("color", plt.get_cmap("tab20")(np.linspace(0,1,20)))

plt.subplots_adjust(left=0.06, bottom=0.16, right=0.97, top=0.95)

cc = cycler('ls', ['-', '--', ':', '-.'])
ax.set_prop_cycle( plt.rcParams['axes.prop_cycle'] * cc)
ax.plot(df, linewidth=1.8)
ax.legend(df.columns, fontsize=9, ncol=10, loc='center' ,bbox_to_anchor=(0, -0.18, 1, 0.102),  frameon=True, facecolor="#eeeeee")
ax.set_axisbelow(True)

plt.ylabel("Per 100,000 persons", fontsize=12)
plt.ylim([0,40])
plt.xlim(-0.5, len(df)-.5)

plt.title("Suicide rates, age-standardised (OECD Health)", fontsize=16)
plt.tick_params(labelsize=9, pad=4)
plt.xticks(rotation=35, fontsize=7)
plt.yticks(fontsize=11)

ax.minorticks_on()
plt.grid(which='major',color='#999999',linestyle='-', axis="y")
plt.grid(which='minor',color='#eeeeee',linestyle='--', axis="y")

plt.savefig("image.svg")
see also[edit]
File history
Click on a date/time to view the file as it appeared at that time.
| Date/Time | Thumbnail | Dimensions | User | Comment | |
|---|---|---|---|---|---|
| current | 18:14, 26 June 2023 | | 1,080 × 720 (208 KB) | Yuasan (talk | contribs) | fix |
| 18:06, 26 June 2023 |  | 1,080 × 720 (218 KB) | Yuasan (talk | contribs) | 2020 data | |
| 13:54, 2 April 2022 |  | 1,080 × 720 (106 KB) | Yuasan (talk | contribs) | 2019 data | |
| 15:06, 24 June 2020 |  | 1,440 × 720 (75 KB) | Yuasan (talk | contribs) | 2017 data | |
| 04:16, 24 November 2014 |  | 751 × 449 (65 KB) | Yuasan (talk | contribs) | User created page with UploadWizard |
You cannot overwrite this file.
File usage on Commons
The following page uses this file:
- File:Oecd-suicide.svg (file redirect)
File usage on other wikis
The following other wikis use this file: