File:Operating systems used on top 500 supercomputers.svg
Siirry navigaatioon
Siirry hakuun

Tämän PNG-esikatselun koko koskien SVG-tiedostoa: 800 × 480 kuvapistettä. Muut resoluutiot: 320 × 192 kuvapistettä | 1 024 × 614 kuvapistettä | 1 280 × 768 kuvapistettä | 2 560 × 1 536 kuvapistettä | 1 200 × 720 kuvapistettä.
Alkuperäinen tiedosto (SVG-tiedosto; oletustarkkuus 1 200 × 720 kuvapistettä; tiedostokoko 47 KiB)
Kuvatekstit
Kuvatekstit
Lisää yhden rivin pituinen kuvaus tästä tiedostosta
Yhteenveto[muokkaa]
| Kuvaus |
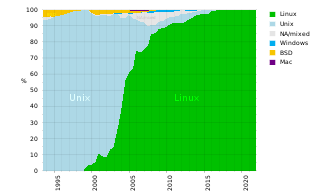
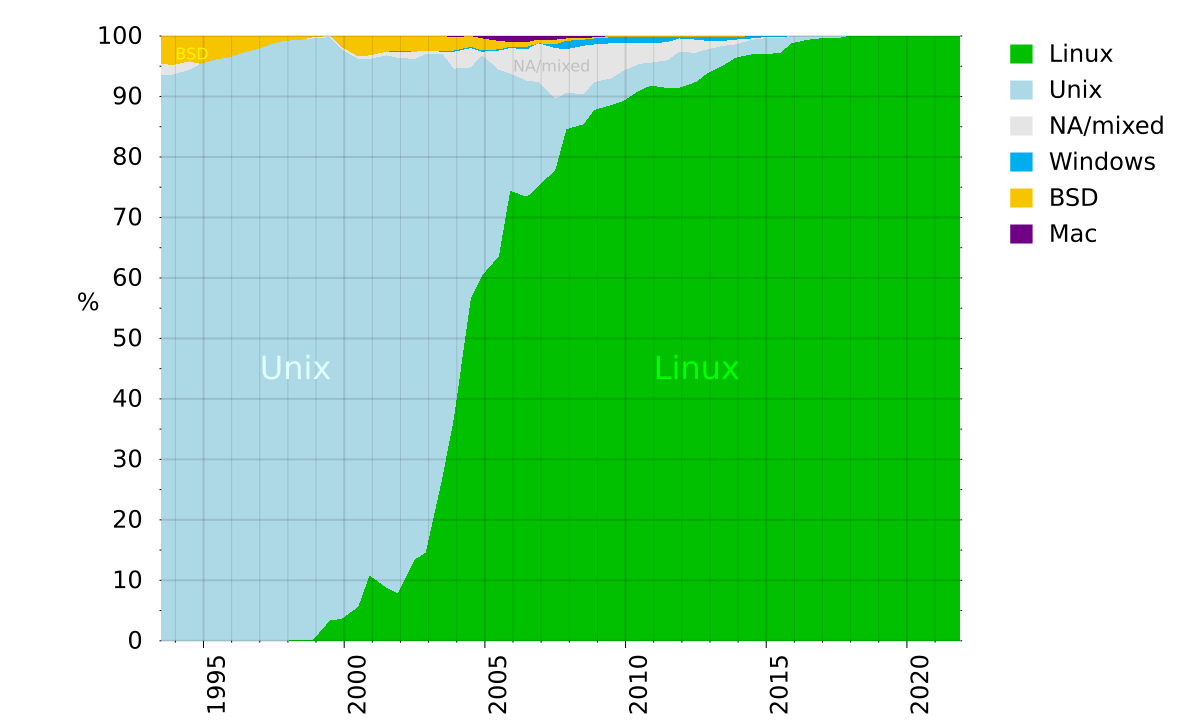
English: This figure shows the operating systems used on the supercomputers listed on the Top500 list. Data for this figure was compiled from http://top500.org/stats |
| Päiväys | |
| Lähde | Eigenes Werk (own work) / source top500.org |
| Tekijä | Benedikt.Seidl |
| Muut versiot |
Tämän tiedoston johdannaisteoksia: Operating systems used on top 500 supercomputers de.svg Image:Top500_OS.png |
Lisenssi[muokkaa]
| Minä, tämän teoksen tekijänoikeudellinen omistaja, julkaisen tämän teoksen public domainiin eli luovun kaikista tekijänoikeuksista lain sallimissa puitteissa. Tämä on voimassa maailmanlaajuisesti. Joissain maissa laki ei mahdollista tätä. Mikäli näin on: Myönnän kenelle tahansa oikeuden käyttää tätä teosta mihin tahansa tarkoitukseen, ilman mitään ehtoja, ellei laki vaadi ehtojen asettamista. |
W3C-validity not checked.
Verwendetes Script für Gnuplot[muokkaa]
#!/usr/bin/gnuplot
#
# Gnuplot Script zur Erstellung des SVG-Dokuments
#

unset border

# using native size of 1200 * 720 = (2*2*2*2*3*5*5) * (2*2*2*2*3*3*5)
# so that size can be divided by 1, 2, 3, 4, 5, 6, 8, 10, 12, 15, 16, 20, 24, 30, 40, 48, 60, 80, 120, 240 without aliasing
set terminal svg size 1200 720 fname "DejaVu Sans,24" enhanced
set output "Operating_systems_used_on_top_500_supercomputers.svg"

set ylabel rotate by 0 "%" offset 3,1.0
set key invert reverse Left outside samplen 0.2
set xtics out  scale 0.4,0.1  rotate by 90 offset 0.8,character -1.4  1990,5,2038  nomirror
set ytics out  scale 0.1,0.1  0,10,100
set mxtics 5
set mytics 2
show mxtics
show mytics

set yrange [0:100]

set grid xtics mxtics ytics  front \
    linetype 3 linewidth 2 lc rgb "#e0000000",\
    linetype 3 linewidth 1 lc rgb "#e0000000"
show grid

set label "Unix"     at 1997,45 front font ",32" textcolor "light-cyan"
set label "Linux"    at 2011,45 front font ",32" textcolor "green"
set label "NA/mixed" at 2006,95 front font ",16" textcolor "grey95"
set label "BSD"      at 1994,97 front font ",16" textcolor "#fef000"
show label

plot \
'cpu.csv' using 1:(100-$7)      :(100)         title "Mac"      with filledcurves lt rgb "#6f0085" ,\
       '' using 1:($2+$4+$6+$3) :(100-$7)      title "BSD"      with filledcurves lt rgb "#f7c500" ,\
       '' using 1:($2+$4+$6)    :($2+$4+$6+$3) title "Windows"  with filledcurves lt rgb "#00adef" ,\
       '' using 1:($2+$4)       :($2+$4+$6)    title "NA/mixed" with filledcurves lt rgb "grey90" ,\
       '' using 1:($2)          :($2+$4)       title "Unix"     with filledcurves lt rgb "light-blue" ,\
       '' using 1:(0)           :($2)          title "Linux"    with filledcurves lt rgb "web-green"


#
# output same data with lines instead of filledcurves, plot two diagram in one
#
set output "Operating_systems_used_on_top_500_supercomputers_detail.svg"
set multiplot

#
# top plot
set size   1, 0.4
set origin 0, 0.6

set border
set bmargin 0.5

set yrange [0:100]

set xtics out  scale 0.5,0.3  rotate by 90 offset 0.8,character -1.4  1990,5,2038  nomirror
set ytics out  scale 0.2,0.2  0,20,100

# do not plot years in top plot
set format x ""
# do not plot legend in top plot
set key off
# use fixed width for y
set format y "%3g"

set ylabel rotate by 0 "%" offset 2.5,0

set grid xtics mxtics ytics  back \
    linetype 3 linewidth 2 dashtype 2 lc rgb "#e0000000",\
    linetype 3 linewidth 2 dashtype 3 lc rgb "#e0000000"

unset label

plot   '' using 1:2 title "Linux"    with lines lw 5 lt rgb "web-green" ,\
       '' using 1:4 title "Unix"     with lines lw 5 lt rgb "light-blue" , \
       '' using 1:5 title "BSD"      with lines lw 5 lt rgb "#f7c500" ,\
       '' using 1:3 title "Windows"  with lines lw 5 lt rgb "#00adef" ,\
       '' using 1:7 title "Mac"      with lines lw 5 lt rgb "#6f0085" ,\
       '' using 1:6 title "NA/mixed" with lines lw 5 lt rgb "grey80"

#
# bottom plot
set size   1, 0.6
set origin 0, 0.0

# plot years
set format x "%g"
set bmargin 5
set tmargin 0

set yrange [0:10]
set ytics out  scale 0.2,0.2  0,2,9
set key below horizontal samplen 0.2 box lt rgb "grey"

replot

unset multiplot

set term pop
The above script also generates another diagram with detail view.

Verwendete Daten[muokkaa]
# year  linux   windows unix    bsd     na_mixed        mac
1993.5	0	0	93.60 	4.60 	1.80 	0
1993.9	0	0	93.60 	4.80 	1.60 	0
1994.5	0	0	94.40 	4.20 	1.40 	0
1994.9	0	0	95.40 	4.60 	0	0
1995.5	0	0	96.20 	3.80 	0	0
1995.9	0	0	96.40 	3.60 	0	0
1996.5	0	0	97.40 	2.60 	0	0
1996.9	0	0	97.80 	2.20 	0	0
1997.5	0	0	98.80 	1.20 	0	0
1997.9	0	0	99.20 	0.80 	0	0
1998.5	0.20 	0	99.20 	0.60 	0	0
1998.9	0.20 	0	99.40 	0.20 	0.20 	0
1999.5	3.40 	0	96.40 	0	0.20 	0
1999.9	3.60 	0	94.20 	1.80 	0.40 	0
2000.5	5.60 	0	90.60 	3.40 	0.40 	0
2000.9	10.80 	0	85.40 	3.20 	0.60 	0
2001.5	8.80 	0	88.00 	2.60 	0.60 	0
2001.9	7.80 	0.20 	88.60 	2.40 	1.00 	0
2002.5	13.40 	0	82.80 	2.60 	1.20 	0
2002.9	14.60 	0	82.40 	2.40 	0.60 	0
2003.5	27.20 	0.20 	69.80 	2.40 	0.40 	0
2003.9	36.80 	0.20 	57.80 	2.20 	2.80 	0.20
2004.5	56.60 	0.20 	38.20 	1.80 	3.20 	0
2004.9	60.40 	0.20 	36.40 	2.00 	0.60 	0.40
2005.5	63.60 	0.20 	30.80 	1.40 	3.20 	0.80
2005.9	74.40 	0.20 	19.40 	0.80 	4.20 	1.00
2006.5	73.40 	0.40 	19.20 	0.80 	5.20 	1.00
2006.9	75.20 	0	17.20 	0.60 	6.40 	0.60
2007.5	77.80 	0.60 	11.80 	0.80 	8.40 	0.60
2007.9	84.60 	1.40 	6.00 	0.40 	7.20 	0.40
2008.5	85.40 	1.00 	5.00 	0.20 	8.00 	0.40
2008.9	87.80 	1.00 	4.60 	0.20 	6.20 	0.20
2009.5  88.60   1.00    4.40    0.20    5.80    0
2009.9  89.20   1.00    5.00    0.20    4.60    0
2010.5  91.00   1.00    4.40    0.20    3.40    0
2010.9  91.80   1.00    3.80    0.20    3.20    0
2011.5  91.4    0.8     4.6     0.2     3.0     0       # as retrieved 2011-12-02
2011.9  91.4    0.2     6.0     0.2     2.2     0       # as retrieved 2011-12-02
2012.5  92.4    0.4     4.8     0.4     2.2     0       # as retrieved 2012-10-27 http://i.top500.org/stats
2012.9  93.8    0.6     4.0     0.2     1.4     0       # as retrieved 2012-11-12 http://www.top500.org/statistics/list
2013.5  95.2    0.6     3.2     0.2     0.8     0       # as retrieved 2013-06-19 http://www.top500.org/statistics/list
2013.9  96.4    0.4     2.2     0.2     0.8     0       # as retrieved 2013-11-18 http://www.top500.org/statistics/list
2014.5  97.0    0.4     2.4     0.0     0.2     0       # as retrieved 2014-06-23 http://www.top500.org/statistics/list
2014.9  97.0    0.2     2.6     0.0     0.2     0       # as retrieved 2014-11-17 http://www.top500.org/statistics/list
2015.5  97.2    0.2     2.4     0.0     0.2     0       # as retrieved 2015-07-13 http://www.top500.org/statistics/list
2015.9  98.8    0.0     1.2     0.0     0.0     0       # as retrieved 2015-11-16 http://www.top500.org/statistics/list
2016.5  99.4    0       0.6     0       0       0       # as retrieved 2016-06-20 http://www.top500.org/statistics/list
2016.9  99.6    0       0.4     0       0       0       # as retrieved 2016-11-14 http://www.top500.org/statistics/list
2017.5  99.6    0       0.4     0       0       0       # as retrieved 2017-06-19 http://www.top500.org/statistics/list
2017.9  100     0       0       0       0       0       # as retrieved 2017-11-13 http://www.top500.org/statistics/list
2018.5  100     0       0       0       0       0       # as retrieved 2018-06-25 http://www.top500.org/statistics/list
2018.9  100     0       0       0       0       0       # as retrieved 2018-11-12 http://www.top500.org/statistics/list
2019.5  100     0       0       0       0       0       # as retrieved 2019-06-17 http://www.top500.org/statistics/list
2019.9  100     0       0       0       0       0       # as retrieved 2022-04-21 http://www.top500.org/statistics/list
2020.5  100     0       0       0       0       0       # as retrieved 2022-04-21 http://www.top500.org/statistics/list
2020.9  100     0       0       0       0       0       # as retrieved 2022-04-21 http://www.top500.org/statistics/list
2021.5  100     0       0       0       0       0       # as retrieved 2022-04-21 http://www.top500.org/statistics/list
2021.9  100     0       0       0       0       0       # as retrieved 2022-04-21 http://www.top500.org/statistics/list
Tiedoston historia
Päiväystä napsauttamalla näet, millainen tiedosto oli kyseisellä hetkellä.


Et voi tallentaa uutta tiedostoa tämän tilalle.
Tiedoston käyttö
Seuraavat 3 sivua käyttävät tätä tiedostoa:
Tiedoston järjestelmänlaajuinen käyttö
Seuraavat muut wikit käyttävät tätä tiedostoa:
- Käyttö kohteessa az.wikipedia.org
- Käyttö kohteessa cs.wikipedia.org
- Käyttö kohteessa de.wikipedia.org
- Käyttö kohteessa de.wikibooks.org
- Käyttö kohteessa en.wikipedia.org
- Käyttö kohteessa et.wikipedia.org
- Käyttö kohteessa eu.wikipedia.org
- Käyttö kohteessa fi.wikipedia.org
- Käyttö kohteessa it.wikipedia.org
- Käyttö kohteessa ja.wikipedia.org
- Käyttö kohteessa ko.wikipedia.org
- Käyttö kohteessa ru.wikipedia.org
- Käyttö kohteessa si.wikipedia.org
- Käyttö kohteessa tr.wikipedia.org
- Käyttö kohteessa uk.wikipedia.org
- Käyttö kohteessa zh.wikipedia.org