File:Operating systems used on top 500 supercomputers.svg
Перейти к навигации
Перейти к поиску

Размер этого PNG-превью для исходного SVG-файла: 800 × 480 пкс. Другие разрешения: 320 × 192 пкс | 1024 × 614 пкс | 1280 × 768 пкс | 2560 × 1536 пкс | 1200 × 720 пкс.
Исходный файл (SVG-файл, номинально 1200 × 720 пкс, размер файла: 47 КБ)
Краткие подписи
Краткие подписи
Добавьте однострочное описание того, что собой представляет этот файл
Краткое описание[править]
| Описание |
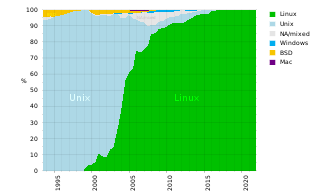
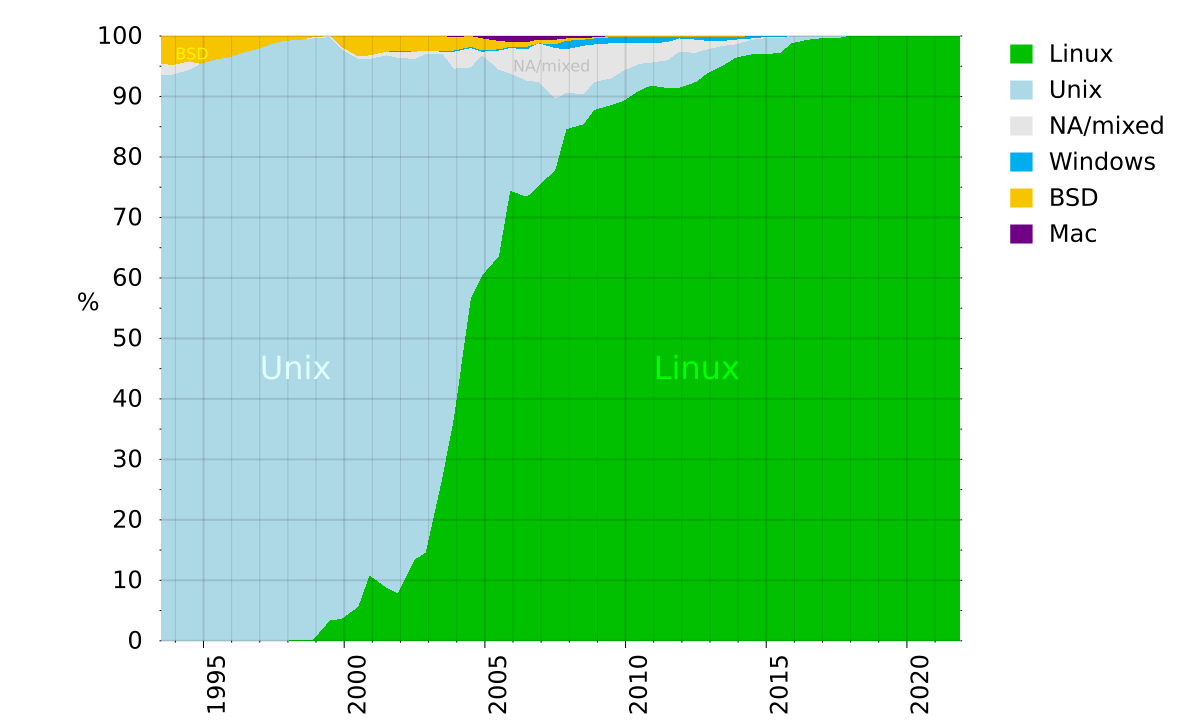
English: This figure shows the operating systems used on the supercomputers listed on the Top500 list. Data for this figure was compiled from http://top500.org/stats |
| Дата | |
| Источник | Eigenes Werk (own work) / source top500.org |
| Автор | Benedikt.Seidl |
| Другие версии |
Производные работы от этого файла: Operating systems used on top 500 supercomputers de.svg Image:Top500_OS.png |
Лицензирование[править]
| Я, владелец авторских прав на это произведение, передаю его в общественное достояние. Это разрешение действует по всему миру. В некоторых странах это не может быть возможно юридически, в таком случае: Я даю право кому угодно использовать данное произведение в любых целях без каких-либо условий, за исключением таких условий, которые требуются по закону. |
W3C-validity not checked.
Verwendetes Script für Gnuplot[править]
#!/usr/bin/gnuplot
#
# Gnuplot Script zur Erstellung des SVG-Dokuments
#

unset border

# using native size of 1200 * 720 = (2*2*2*2*3*5*5) * (2*2*2*2*3*3*5)
# so that size can be divided by 1, 2, 3, 4, 5, 6, 8, 10, 12, 15, 16, 20, 24, 30, 40, 48, 60, 80, 120, 240 without aliasing
set terminal svg size 1200 720 fname "DejaVu Sans,24" enhanced
set output "Operating_systems_used_on_top_500_supercomputers.svg"

set ylabel rotate by 0 "%" offset 3,1.0
set key invert reverse Left outside samplen 0.2
set xtics out  scale 0.4,0.1  rotate by 90 offset 0.8,character -1.4  1990,5,2038  nomirror
set ytics out  scale 0.1,0.1  0,10,100
set mxtics 5
set mytics 2
show mxtics
show mytics

set yrange [0:100]

set grid xtics mxtics ytics  front \
    linetype 3 linewidth 2 lc rgb "#e0000000",\
    linetype 3 linewidth 1 lc rgb "#e0000000"
show grid

set label "Unix"     at 1997,45 front font ",32" textcolor "light-cyan"
set label "Linux"    at 2011,45 front font ",32" textcolor "green"
set label "NA/mixed" at 2006,95 front font ",16" textcolor "grey95"
set label "BSD"      at 1994,97 front font ",16" textcolor "#fef000"
show label

plot \
'cpu.csv' using 1:(100-$7)      :(100)         title "Mac"      with filledcurves lt rgb "#6f0085" ,\
       '' using 1:($2+$4+$6+$3) :(100-$7)      title "BSD"      with filledcurves lt rgb "#f7c500" ,\
       '' using 1:($2+$4+$6)    :($2+$4+$6+$3) title "Windows"  with filledcurves lt rgb "#00adef" ,\
       '' using 1:($2+$4)       :($2+$4+$6)    title "NA/mixed" with filledcurves lt rgb "grey90" ,\
       '' using 1:($2)          :($2+$4)       title "Unix"     with filledcurves lt rgb "light-blue" ,\
       '' using 1:(0)           :($2)          title "Linux"    with filledcurves lt rgb "web-green"


#
# output same data with lines instead of filledcurves, plot two diagram in one
#
set output "Operating_systems_used_on_top_500_supercomputers_detail.svg"
set multiplot

#
# top plot
set size   1, 0.4
set origin 0, 0.6

set border
set bmargin 0.5

set yrange [0:100]

set xtics out  scale 0.5,0.3  rotate by 90 offset 0.8,character -1.4  1990,5,2038  nomirror
set ytics out  scale 0.2,0.2  0,20,100

# do not plot years in top plot
set format x ""
# do not plot legend in top plot
set key off
# use fixed width for y
set format y "%3g"

set ylabel rotate by 0 "%" offset 2.5,0

set grid xtics mxtics ytics  back \
    linetype 3 linewidth 2 dashtype 2 lc rgb "#e0000000",\
    linetype 3 linewidth 2 dashtype 3 lc rgb "#e0000000"

unset label

plot   '' using 1:2 title "Linux"    with lines lw 5 lt rgb "web-green" ,\
       '' using 1:4 title "Unix"     with lines lw 5 lt rgb "light-blue" , \
       '' using 1:5 title "BSD"      with lines lw 5 lt rgb "#f7c500" ,\
       '' using 1:3 title "Windows"  with lines lw 5 lt rgb "#00adef" ,\
       '' using 1:7 title "Mac"      with lines lw 5 lt rgb "#6f0085" ,\
       '' using 1:6 title "NA/mixed" with lines lw 5 lt rgb "grey80"

#
# bottom plot
set size   1, 0.6
set origin 0, 0.0

# plot years
set format x "%g"
set bmargin 5
set tmargin 0

set yrange [0:10]
set ytics out  scale 0.2,0.2  0,2,9
set key below horizontal samplen 0.2 box lt rgb "grey"

replot

unset multiplot

set term pop
The above script also generates another diagram with detail view.

Verwendete Daten[править]
# year  linux   windows unix    bsd     na_mixed        mac
1993.5	0	0	93.60 	4.60 	1.80 	0
1993.9	0	0	93.60 	4.80 	1.60 	0
1994.5	0	0	94.40 	4.20 	1.40 	0
1994.9	0	0	95.40 	4.60 	0	0
1995.5	0	0	96.20 	3.80 	0	0
1995.9	0	0	96.40 	3.60 	0	0
1996.5	0	0	97.40 	2.60 	0	0
1996.9	0	0	97.80 	2.20 	0	0
1997.5	0	0	98.80 	1.20 	0	0
1997.9	0	0	99.20 	0.80 	0	0
1998.5	0.20 	0	99.20 	0.60 	0	0
1998.9	0.20 	0	99.40 	0.20 	0.20 	0
1999.5	3.40 	0	96.40 	0	0.20 	0
1999.9	3.60 	0	94.20 	1.80 	0.40 	0
2000.5	5.60 	0	90.60 	3.40 	0.40 	0
2000.9	10.80 	0	85.40 	3.20 	0.60 	0
2001.5	8.80 	0	88.00 	2.60 	0.60 	0
2001.9	7.80 	0.20 	88.60 	2.40 	1.00 	0
2002.5	13.40 	0	82.80 	2.60 	1.20 	0
2002.9	14.60 	0	82.40 	2.40 	0.60 	0
2003.5	27.20 	0.20 	69.80 	2.40 	0.40 	0
2003.9	36.80 	0.20 	57.80 	2.20 	2.80 	0.20
2004.5	56.60 	0.20 	38.20 	1.80 	3.20 	0
2004.9	60.40 	0.20 	36.40 	2.00 	0.60 	0.40
2005.5	63.60 	0.20 	30.80 	1.40 	3.20 	0.80
2005.9	74.40 	0.20 	19.40 	0.80 	4.20 	1.00
2006.5	73.40 	0.40 	19.20 	0.80 	5.20 	1.00
2006.9	75.20 	0	17.20 	0.60 	6.40 	0.60
2007.5	77.80 	0.60 	11.80 	0.80 	8.40 	0.60
2007.9	84.60 	1.40 	6.00 	0.40 	7.20 	0.40
2008.5	85.40 	1.00 	5.00 	0.20 	8.00 	0.40
2008.9	87.80 	1.00 	4.60 	0.20 	6.20 	0.20
2009.5  88.60   1.00    4.40    0.20    5.80    0
2009.9  89.20   1.00    5.00    0.20    4.60    0
2010.5  91.00   1.00    4.40    0.20    3.40    0
2010.9  91.80   1.00    3.80    0.20    3.20    0
2011.5  91.4    0.8     4.6     0.2     3.0     0       # as retrieved 2011-12-02
2011.9  91.4    0.2     6.0     0.2     2.2     0       # as retrieved 2011-12-02
2012.5  92.4    0.4     4.8     0.4     2.2     0       # as retrieved 2012-10-27 http://i.top500.org/stats
2012.9  93.8    0.6     4.0     0.2     1.4     0       # as retrieved 2012-11-12 http://www.top500.org/statistics/list
2013.5  95.2    0.6     3.2     0.2     0.8     0       # as retrieved 2013-06-19 http://www.top500.org/statistics/list
2013.9  96.4    0.4     2.2     0.2     0.8     0       # as retrieved 2013-11-18 http://www.top500.org/statistics/list
2014.5  97.0    0.4     2.4     0.0     0.2     0       # as retrieved 2014-06-23 http://www.top500.org/statistics/list
2014.9  97.0    0.2     2.6     0.0     0.2     0       # as retrieved 2014-11-17 http://www.top500.org/statistics/list
2015.5  97.2    0.2     2.4     0.0     0.2     0       # as retrieved 2015-07-13 http://www.top500.org/statistics/list
2015.9  98.8    0.0     1.2     0.0     0.0     0       # as retrieved 2015-11-16 http://www.top500.org/statistics/list
2016.5  99.4    0       0.6     0       0       0       # as retrieved 2016-06-20 http://www.top500.org/statistics/list
2016.9  99.6    0       0.4     0       0       0       # as retrieved 2016-11-14 http://www.top500.org/statistics/list
2017.5  99.6    0       0.4     0       0       0       # as retrieved 2017-06-19 http://www.top500.org/statistics/list
2017.9  100     0       0       0       0       0       # as retrieved 2017-11-13 http://www.top500.org/statistics/list
2018.5  100     0       0       0       0       0       # as retrieved 2018-06-25 http://www.top500.org/statistics/list
2018.9  100     0       0       0       0       0       # as retrieved 2018-11-12 http://www.top500.org/statistics/list
2019.5  100     0       0       0       0       0       # as retrieved 2019-06-17 http://www.top500.org/statistics/list
2019.9  100     0       0       0       0       0       # as retrieved 2022-04-21 http://www.top500.org/statistics/list
2020.5  100     0       0       0       0       0       # as retrieved 2022-04-21 http://www.top500.org/statistics/list
2020.9  100     0       0       0       0       0       # as retrieved 2022-04-21 http://www.top500.org/statistics/list
2021.5  100     0       0       0       0       0       # as retrieved 2022-04-21 http://www.top500.org/statistics/list
2021.9  100     0       0       0       0       0       # as retrieved 2022-04-21 http://www.top500.org/statistics/list
История файла
Нажмите на дату/время, чтобы увидеть версию файла от того времени.
| Дата/время | Миниатюра | Размеры | Участник | Примечание | |
|---|---|---|---|---|---|
| текущий | 19:17, 21 апреля 2022 | | 1200 × 720 (47 КБ) | Benedikt.Seidl (обсуждение | вклад) | update 2021 |
| 20:47, 17 июня 2019 |  | 1200 × 720 (43 КБ) | HeWhoMowedTheLawn (обсуждение | вклад) | Updated to June 2019 data | |
| 20:49, 13 ноября 2018 |  | 1200 × 720 (43 КБ) | HeWhoMowedTheLawn (обсуждение | вклад) | updated to Nov 2018 data | |
| 11:24, 1 июля 2018 |  | 1200 × 720 (42 КБ) | HeWhoMowedTheLawn (обсуждение | вклад) | add in-diagram labels | |
| 10:13, 1 июля 2018 |  | 1200 × 720 (42 КБ) | HeWhoMowedTheLawn (обсуждение | вклад) | updated to June 2018 data | |
| 18:01, 13 ноября 2017 |  | 1200 × 720 (61 КБ) | HeWhoMowedTheLawn (обсуждение | вклад) | Oops, world domination reached. What's next? | |
| 08:28, 22 июня 2017 |  | 1200 × 720 (60 КБ) | HeWhoMowedTheLawn (обсуждение | вклад) | updated to June 2017 data | |
| 22:31, 14 ноября 2016 |  | 1200 × 720 (60 КБ) | HeWhoMowedTheLawn (обсуждение | вклад) | Updated to Nov 2016 data | |
| 19:10, 20 июня 2016 |  | 1200 × 720 (59 КБ) | HeWhoMowedTheLawn (обсуждение | вклад) | updated to June 2016 data | |
| 18:55, 17 ноября 2015 |  | 1200 × 720 (58 КБ) | HeWhoMowedTheLawn (обсуждение | вклад) | updated to Nov 2015 data |
Вы не можете перезаписать этот файл.
Использование файла
Следующие 3 страницы используют этот файл:
Глобальное использование файла
Данный файл используется в следующих вики:
- Использование в az.wikipedia.org
- Использование в cs.wikipedia.org
- Использование в de.wikipedia.org
- Использование в de.wikibooks.org
- Использование в en.wikipedia.org
- Использование в et.wikipedia.org
- Использование в eu.wikipedia.org
- Использование в fi.wikipedia.org
- Использование в it.wikipedia.org
- Использование в ja.wikipedia.org
- Использование в ko.wikipedia.org
- Использование в ru.wikipedia.org
- Использование в si.wikipedia.org
- Использование в tr.wikipedia.org
- Использование в uk.wikipedia.org
- Использование в zh.wikipedia.org