File:Operating systems used on top 500 supercomputers.svg
跳至導覽
跳至搜尋

此 SVG 檔案的 PNG 預覽的大小:800 × 480 像素。 其他解析度:320 × 192 像素 | 1,024 × 614 像素 | 1,280 × 768 像素 | 2,560 × 1,536 像素 | 1,200 × 720 像素。
原始檔案 (SVG 檔案,表面大小:1,200 × 720 像素,檔案大小:47 KB)
說明
說明
添加單行說明來描述出檔案所代表的內容
摘要
[編輯]
| 描述 |
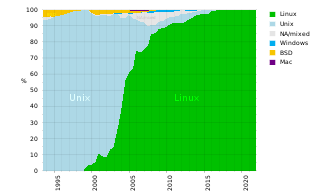
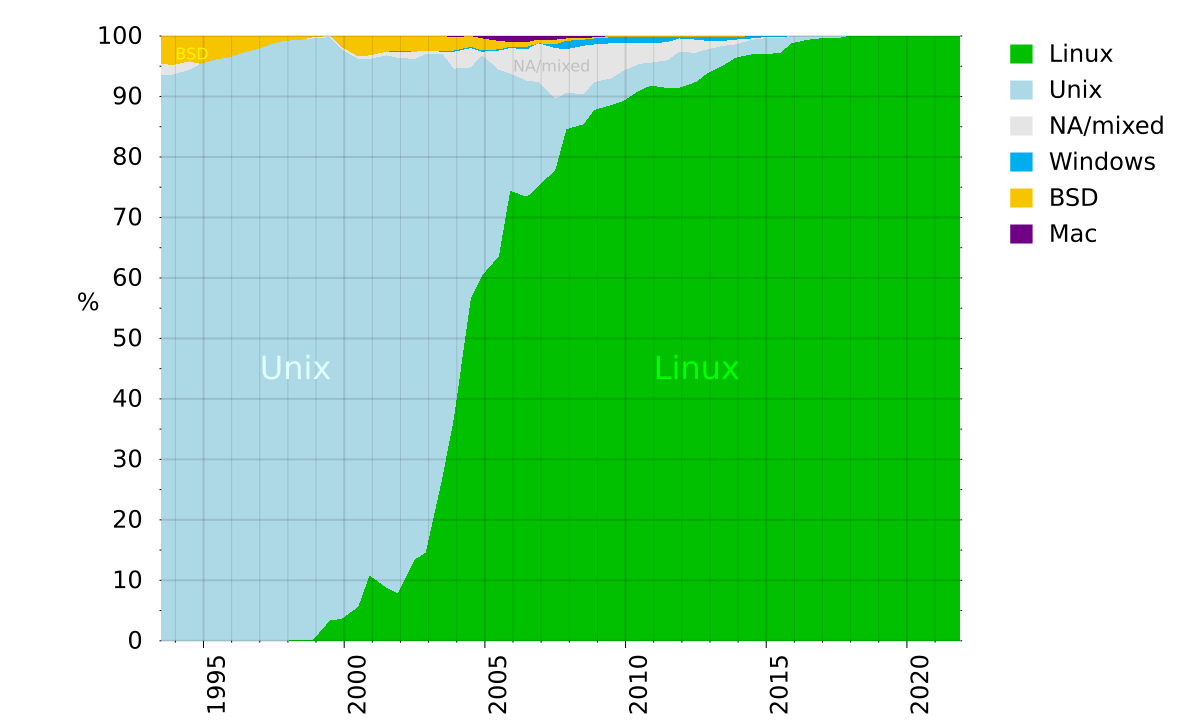
English: This figure shows the operating systems used on the supercomputers listed on the Top500 list. Data for this figure was compiled from http://top500.org/stats |
| 日期 | |
| 來源 | Eigenes Werk (own work) / source top500.org |
| 作者 | Benedikt.Seidl |
| 其他版本 |
此檔案衍生的作品: Operating systems used on top 500 supercomputers de.svg Image:Top500_OS.png |
授權條款
[編輯]
| 我,此作品的版權所有人,釋出此作品至公共領域。此授權條款在全世界均適用。 這可能在某些國家不合法,如果是的話: 我授予任何人有權利使用此作品於任何用途,除受法律約束外,不受任何限制。 |
W3C-validity not checked.
Verwendetes Script für Gnuplot
[編輯]
#!/usr/bin/gnuplot
#
# Gnuplot Script zur Erstellung des SVG-Dokuments
#

unset border

# using native size of 1200 * 720 = (2*2*2*2*3*5*5) * (2*2*2*2*3*3*5)
# so that size can be divided by 1, 2, 3, 4, 5, 6, 8, 10, 12, 15, 16, 20, 24, 30, 40, 48, 60, 80, 120, 240 without aliasing
set terminal svg size 1200 720 fname "DejaVu Sans,24" enhanced
set output "Operating_systems_used_on_top_500_supercomputers.svg"

set ylabel rotate by 0 "%" offset 3,1.0
set key invert reverse Left outside samplen 0.2
set xtics out  scale 0.4,0.1  rotate by 90 offset 0.8,character -1.4  1990,5,2038  nomirror
set ytics out  scale 0.1,0.1  0,10,100
set mxtics 5
set mytics 2
show mxtics
show mytics

set yrange [0:100]

set grid xtics mxtics ytics  front \
    linetype 3 linewidth 2 lc rgb "#e0000000",\
    linetype 3 linewidth 1 lc rgb "#e0000000"
show grid

set label "Unix"     at 1997,45 front font ",32" textcolor "light-cyan"
set label "Linux"    at 2011,45 front font ",32" textcolor "green"
set label "NA/mixed" at 2006,95 front font ",16" textcolor "grey95"
set label "BSD"      at 1994,97 front font ",16" textcolor "#fef000"
show label

plot \
'cpu.csv' using 1:(100-$7)      :(100)         title "Mac"      with filledcurves lt rgb "#6f0085" ,\
       '' using 1:($2+$4+$6+$3) :(100-$7)      title "BSD"      with filledcurves lt rgb "#f7c500" ,\
       '' using 1:($2+$4+$6)    :($2+$4+$6+$3) title "Windows"  with filledcurves lt rgb "#00adef" ,\
       '' using 1:($2+$4)       :($2+$4+$6)    title "NA/mixed" with filledcurves lt rgb "grey90" ,\
       '' using 1:($2)          :($2+$4)       title "Unix"     with filledcurves lt rgb "light-blue" ,\
       '' using 1:(0)           :($2)          title "Linux"    with filledcurves lt rgb "web-green"


#
# output same data with lines instead of filledcurves, plot two diagram in one
#
set output "Operating_systems_used_on_top_500_supercomputers_detail.svg"
set multiplot

#
# top plot
set size   1, 0.4
set origin 0, 0.6

set border
set bmargin 0.5

set yrange [0:100]

set xtics out  scale 0.5,0.3  rotate by 90 offset 0.8,character -1.4  1990,5,2038  nomirror
set ytics out  scale 0.2,0.2  0,20,100

# do not plot years in top plot
set format x ""
# do not plot legend in top plot
set key off
# use fixed width for y
set format y "%3g"

set ylabel rotate by 0 "%" offset 2.5,0

set grid xtics mxtics ytics  back \
    linetype 3 linewidth 2 dashtype 2 lc rgb "#e0000000",\
    linetype 3 linewidth 2 dashtype 3 lc rgb "#e0000000"

unset label

plot   '' using 1:2 title "Linux"    with lines lw 5 lt rgb "web-green" ,\
       '' using 1:4 title "Unix"     with lines lw 5 lt rgb "light-blue" , \
       '' using 1:5 title "BSD"      with lines lw 5 lt rgb "#f7c500" ,\
       '' using 1:3 title "Windows"  with lines lw 5 lt rgb "#00adef" ,\
       '' using 1:7 title "Mac"      with lines lw 5 lt rgb "#6f0085" ,\
       '' using 1:6 title "NA/mixed" with lines lw 5 lt rgb "grey80"

#
# bottom plot
set size   1, 0.6
set origin 0, 0.0

# plot years
set format x "%g"
set bmargin 5
set tmargin 0

set yrange [0:10]
set ytics out  scale 0.2,0.2  0,2,9
set key below horizontal samplen 0.2 box lt rgb "grey"

replot

unset multiplot

set term pop
The above script also generates another diagram with detail view.

Verwendete Daten
[編輯]
# year  linux   windows unix    bsd     na_mixed        mac
1993.5	0	0	93.60 	4.60 	1.80 	0
1993.9	0	0	93.60 	4.80 	1.60 	0
1994.5	0	0	94.40 	4.20 	1.40 	0
1994.9	0	0	95.40 	4.60 	0	0
1995.5	0	0	96.20 	3.80 	0	0
1995.9	0	0	96.40 	3.60 	0	0
1996.5	0	0	97.40 	2.60 	0	0
1996.9	0	0	97.80 	2.20 	0	0
1997.5	0	0	98.80 	1.20 	0	0
1997.9	0	0	99.20 	0.80 	0	0
1998.5	0.20 	0	99.20 	0.60 	0	0
1998.9	0.20 	0	99.40 	0.20 	0.20 	0
1999.5	3.40 	0	96.40 	0	0.20 	0
1999.9	3.60 	0	94.20 	1.80 	0.40 	0
2000.5	5.60 	0	90.60 	3.40 	0.40 	0
2000.9	10.80 	0	85.40 	3.20 	0.60 	0
2001.5	8.80 	0	88.00 	2.60 	0.60 	0
2001.9	7.80 	0.20 	88.60 	2.40 	1.00 	0
2002.5	13.40 	0	82.80 	2.60 	1.20 	0
2002.9	14.60 	0	82.40 	2.40 	0.60 	0
2003.5	27.20 	0.20 	69.80 	2.40 	0.40 	0
2003.9	36.80 	0.20 	57.80 	2.20 	2.80 	0.20
2004.5	56.60 	0.20 	38.20 	1.80 	3.20 	0
2004.9	60.40 	0.20 	36.40 	2.00 	0.60 	0.40
2005.5	63.60 	0.20 	30.80 	1.40 	3.20 	0.80
2005.9	74.40 	0.20 	19.40 	0.80 	4.20 	1.00
2006.5	73.40 	0.40 	19.20 	0.80 	5.20 	1.00
2006.9	75.20 	0	17.20 	0.60 	6.40 	0.60
2007.5	77.80 	0.60 	11.80 	0.80 	8.40 	0.60
2007.9	84.60 	1.40 	6.00 	0.40 	7.20 	0.40
2008.5	85.40 	1.00 	5.00 	0.20 	8.00 	0.40
2008.9	87.80 	1.00 	4.60 	0.20 	6.20 	0.20
2009.5  88.60   1.00    4.40    0.20    5.80    0
2009.9  89.20   1.00    5.00    0.20    4.60    0
2010.5  91.00   1.00    4.40    0.20    3.40    0
2010.9  91.80   1.00    3.80    0.20    3.20    0
2011.5  91.4    0.8     4.6     0.2     3.0     0       # as retrieved 2011-12-02
2011.9  91.4    0.2     6.0     0.2     2.2     0       # as retrieved 2011-12-02
2012.5  92.4    0.4     4.8     0.4     2.2     0       # as retrieved 2012-10-27 http://i.top500.org/stats
2012.9  93.8    0.6     4.0     0.2     1.4     0       # as retrieved 2012-11-12 http://www.top500.org/statistics/list
2013.5  95.2    0.6     3.2     0.2     0.8     0       # as retrieved 2013-06-19 http://www.top500.org/statistics/list
2013.9  96.4    0.4     2.2     0.2     0.8     0       # as retrieved 2013-11-18 http://www.top500.org/statistics/list
2014.5  97.0    0.4     2.4     0.0     0.2     0       # as retrieved 2014-06-23 http://www.top500.org/statistics/list
2014.9  97.0    0.2     2.6     0.0     0.2     0       # as retrieved 2014-11-17 http://www.top500.org/statistics/list
2015.5  97.2    0.2     2.4     0.0     0.2     0       # as retrieved 2015-07-13 http://www.top500.org/statistics/list
2015.9  98.8    0.0     1.2     0.0     0.0     0       # as retrieved 2015-11-16 http://www.top500.org/statistics/list
2016.5  99.4    0       0.6     0       0       0       # as retrieved 2016-06-20 http://www.top500.org/statistics/list
2016.9  99.6    0       0.4     0       0       0       # as retrieved 2016-11-14 http://www.top500.org/statistics/list
2017.5  99.6    0       0.4     0       0       0       # as retrieved 2017-06-19 http://www.top500.org/statistics/list
2017.9  100     0       0       0       0       0       # as retrieved 2017-11-13 http://www.top500.org/statistics/list
2018.5  100     0       0       0       0       0       # as retrieved 2018-06-25 http://www.top500.org/statistics/list
2018.9  100     0       0       0       0       0       # as retrieved 2018-11-12 http://www.top500.org/statistics/list
2019.5  100     0       0       0       0       0       # as retrieved 2019-06-17 http://www.top500.org/statistics/list
2019.9  100     0       0       0       0       0       # as retrieved 2022-04-21 http://www.top500.org/statistics/list
2020.5  100     0       0       0       0       0       # as retrieved 2022-04-21 http://www.top500.org/statistics/list
2020.9  100     0       0       0       0       0       # as retrieved 2022-04-21 http://www.top500.org/statistics/list
2021.5  100     0       0       0       0       0       # as retrieved 2022-04-21 http://www.top500.org/statistics/list
2021.9  100     0       0       0       0       0       # as retrieved 2022-04-21 http://www.top500.org/statistics/list
檔案歷史
點選日期/時間以檢視該時間的檔案版本。
| 日期/時間 | 縮圖 | 尺寸 | 使用者 | 備註 | |
|---|---|---|---|---|---|
| 目前 | 2022年4月21日 (四) 19:17 | | 1,200 × 720(47 KB) | Benedikt.Seidl(留言 | 貢獻) | update 2021 |
| 2019年6月17日 (一) 20:47 |  | 1,200 × 720(43 KB) | HeWhoMowedTheLawn(留言 | 貢獻) | Updated to June 2019 data | |
| 2018年11月13日 (二) 20:49 |  | 1,200 × 720(43 KB) | HeWhoMowedTheLawn(留言 | 貢獻) | updated to Nov 2018 data | |
| 2018年7月1日 (日) 11:24 |  | 1,200 × 720(42 KB) | HeWhoMowedTheLawn(留言 | 貢獻) | add in-diagram labels | |
| 2018年7月1日 (日) 10:13 |  | 1,200 × 720(42 KB) | HeWhoMowedTheLawn(留言 | 貢獻) | updated to June 2018 data | |
| 2017年11月13日 (一) 18:01 |  | 1,200 × 720(61 KB) | HeWhoMowedTheLawn(留言 | 貢獻) | Oops, world domination reached. What's next? | |
| 2017年6月22日 (四) 08:28 |  | 1,200 × 720(60 KB) | HeWhoMowedTheLawn(留言 | 貢獻) | updated to June 2017 data | |
| 2016年11月14日 (一) 22:31 |  | 1,200 × 720(60 KB) | HeWhoMowedTheLawn(留言 | 貢獻) | Updated to Nov 2016 data | |
| 2016年6月20日 (一) 19:10 |  | 1,200 × 720(59 KB) | HeWhoMowedTheLawn(留言 | 貢獻) | updated to June 2016 data | |
| 2015年11月17日 (二) 18:55 |  | 1,200 × 720(58 KB) | HeWhoMowedTheLawn(留言 | 貢獻) | updated to Nov 2015 data |
無法覆蓋此檔案。
檔案用途
下列3個頁面有用到此檔案:
全域檔案使用狀況
以下其他 wiki 使用了這個檔案:
- az.wikipedia.org 的使用狀況
- cs.wikipedia.org 的使用狀況
- de.wikipedia.org 的使用狀況
- de.wikibooks.org 的使用狀況
- en.wikipedia.org 的使用狀況
- et.wikipedia.org 的使用狀況
- eu.wikipedia.org 的使用狀況
- fi.wikipedia.org 的使用狀況
- it.wikipedia.org 的使用狀況
- ja.wikipedia.org 的使用狀況
- ko.wikipedia.org 的使用狀況
- ru.wikipedia.org 的使用狀況
- si.wikipedia.org 的使用狀況
- tr.wikipedia.org 的使用狀況
- uk.wikipedia.org 的使用狀況
- zh.wikipedia.org 的使用狀況