File:Photon Cross Sections.png
跳至導覽
跳至搜尋

預覽大小:800 × 581 像素。 其他解析度:320 × 232 像素 | 640 × 465 像素 | 1,024 × 743 像素 | 1,280 × 929 像素。
原始檔案 (1,280 × 929 像素,檔案大小:55 KB,MIME 類型:image/png)
說明
說明
添加單行說明來描述出檔案所代表的內容
摘要
[編輯]
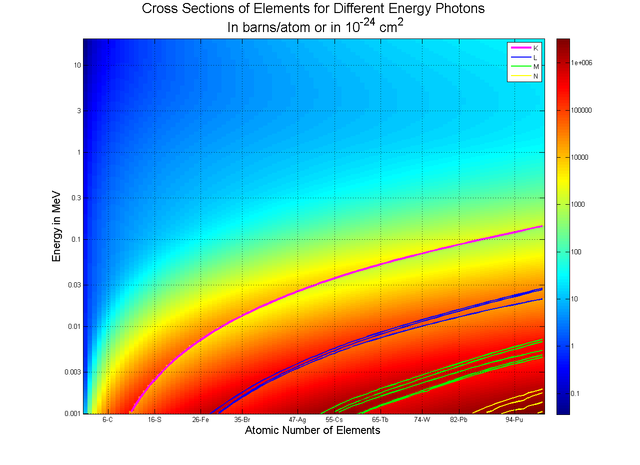
| 描述 | Cross-sections for photons in energy range from 1 keV to 20 MeV for Elements Z = 1 to 100. Based on [1]. Also shown are locations of photons absorption edges (and not Compton edges as mentioned in the comments from the Matlab code). |
| 日期 | |
| 來源 | 自己的作品 |
| 作者 | Jarekt |
The image was generated using the following MATLAB code, with help of external library PhotonAtenuattion2:
figure
Z = 1:100; % elements with Z in 1-100 range
E = logspace(log10(0.001), log10(20), 500);  % define energy grid
X = PhotonAttenuation(Z, E, 'cross section');
colormap(jet(128)) % use hi-res color palette
imagesc(log10(X));
grid on;
axis xy; % put small numbers on y axis on the bottom
title({'Cross Sections of Elements for Different Energy Photons',...
       ' In barns/atom or in 10^{-24} cm^2'});
xlabel('Atomic Number of Elements');
ylabel('Energy in MeV');
% Add X-Axis
EPos = [6 16 26 35 47 55 65 74 82 94];   % define array to store label location
ELab = { '6-C','16-S','26-Fe','35-Br','47-Ag','55-Cs','65-Tb','74-W','82-Pb','94-Pu'}; %Define Energy labels for y-axis
set(gca,'XTick'     ,EPos);
set(gca,'XTickLabel',ELab);
% Add Y-Axis
ELab = [0.001 0.003 0.01 0.03 0.1 0.3 1 3 10]; %Define Energy labels for y-axis
EPos = size(ELab);   % define array to store label location
for i=1:length(ELab), [tmp EPos(i)]=min(abs(E-ELab(i))); end
set(gca,'YTick'     ,EPos);
set(gca,'YTickLabel',ELab);
% add Colorbar
cbar_axes = colorbar;
set(cbar_axes,'YTick'     ,     -1:6 ); % The image is a log10 of the MAC ...
set(cbar_axes,'YTickLabel',10.^(-1:6)); % ... so add proper labels
hold on
% Add Conpton Edges to the plot
[tmp, CEdge] = PhotonAttenuationQ(Z, E);
ed = accumarray([CEdge(:,1),CEdge(:,2)],CEdge(:,3)); % get per element energies of 14 compton edges
ed = 500*(log(ed')-log(0.001))/(log(20)-log(0.001)); % convert energy to row numbers of the image
K=plot(ed(:,1)    ,'m','LineWidth',3); %Plot K Compton edge
L=plot(ed(:, 2: 4),'b','LineWidth',2); %Plot 3 L Compton edges
M=plot(ed(:, 5: 9),'g','LineWidth',2); %Plot 5 M Compton edges
N=plot(ed(:,10:end),'y','LineWidth',2); %Plot first 5 N Compton edges
legend([K(1),L(1),M(1),N(1)], {'K','L','M','N'}, 'Location', 'NorthEast');

|
本圖片是以PNG、GIF或JPEG格式上傳。然而,其中包含的資料或訊息,應該重新建立成可縮放向量圖形(SVG)檔案,以更有效率或更準確的方式儲存。如有可能,請上傳本圖片的SVG格式版本。在上傳之後,請修改維基各姊妹計畫中所有使用舊版圖片的條目(列在圖像連結章節中),替換為新版圖片,並在舊圖片的描述頁中加入{{Vector version available|新圖片名稱.svg}}模板,同時移除本模板。
|
授權條款
[編輯]
我,本作品的著作權持有者,決定用以下授權條款發佈本作品:

|
已授權您依據自由軟體基金會發行的無固定段落、封面文字和封底文字GNU自由文件授權條款1.2版或任意後續版本,對本檔進行複製、傳播和/或修改。該協議的副本列在GNU自由文件授權條款中。 |
您可以選擇您需要的授權條款。
檔案歷史
點選日期/時間以檢視該時間的檔案版本。
| 日期/時間 | 縮圖 | 尺寸 | 用戶 | 備註 | |
|---|---|---|---|---|---|
| 目前 | 2007年9月27日 (四) 03:28 | | 1,280 × 929(55 KB) | Jarekt(對話 | 貢獻) | {{Information |Description='''Cross-sections''' for photons in energy range from 1 keV to 20 MeV for Elements Z = 1 to 100. Based on [http://physics.nist.gov/PhysRefData/XrayNoteB.html]. Also shown are locations of Compton edges. |Source=self-made |Date=9 |
無法覆蓋此檔案。
檔案用途
下列頁面有用到此檔案:
全域檔案使用狀況
以下其他 wiki 使用了這個檔案:
- ar.wikipedia.org 的使用狀況
- en.wikipedia.org 的使用狀況
- vi.wikipedia.org 的使用狀況
- zh.wikipedia.org 的使用狀況