File:Pre-term corticosteroid data.svg
Aller à la navigation
Aller à la recherche

Taille de cet aperçu PNG pour ce fichier SVG : 684 × 309 pixels. Autres résolutions : 320 × 145 pixels | 640 × 289 pixels | 1 024 × 463 pixels | 1 280 × 578 pixels | 2 560 × 1 156 pixels.
Fichier d’origine (Fichier SVG, nominalement de 684 × 309 pixels, taille : 95 kio)
Légendes
Légendes
Ajoutez en une ligne la description de ce que représente ce fichier
Description
[modifier]
| Description |
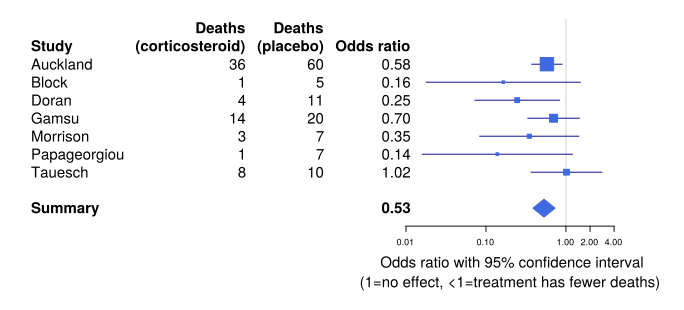
English: This forest plot shows trials of the use of corticosteroids to hasten lung development in pre-term babies. It is an iconic illustration of the power of medical reviews to save lives. The iconic review is from the 1980s, so this plot does not contain all the evidence of the up-to-date version of the same review.
This data is the data from which the logo for Cochrane (organisation) is derived. |
| Date | |
| Source | Source code modified by User:HLHJ from the data and plotting scripts supplied with the GPL-2-licensed software package rmeta (part of the R statistical environment). See rmeta documentation. |
| Auteur | Thomas Lumley, User:HLHJ |
| SVG information | |
| Code source | R codeinstall.packages("rmeta")
library(rmeta)
data(cochrane)
svg("cochrane_logo_data.svg",width=9,height=4.35)
steroid <- meta.MH(n.trt, n.ctrl, ev.trt, ev.ctrl,
names=name, data=cochrane)
tabletext<-cbind(
c("","Study",steroid$names,NA,"Summary"), #Just tags, not single-author papers
# c("","Year",c(1111,1111,1111,1111,1111,1111,1111),NA,NA), #Don't have this data
c("Deaths","(corticosteroid)",cochrane$ev.trt,NA,NA),
c("Deaths","(placebo)", cochrane$ev.ctrl, NA,NA),
c("","Odds ratio",format(exp(steroid$logOR),digits=2),NA,format(exp(steroid$logMH),digits=2))
)
m<- c(NA,NA,steroid$logOR,NA,steroid$logMH) #Mean
l<- m-c(NA,NA,steroid$selogOR,NA,steroid$selogMH)*2 #Lower
u<- m+c(NA,NA,steroid$selogOR,NA,steroid$selogMH)*2 #Upper
forestplot(tabletext,m,l,u,zero=0,is.summary=c(TRUE,TRUE,rep(FALSE,8),TRUE),
clip=c(log(0.015),log(3)), xlog=TRUE,
xticks=c(0.01,0.1,1,2,4),
col=meta.colors(box="royalblue",line="darkblue", summary="royalblue"))
forestplot(tabletext,m,l,u,zero=0,is.summary=c(TRUE,TRUE,rep(FALSE,8),TRUE),
clip=c(log(0.015),log(3)), xlog=TRUE,
#boxsize=0.75,
xticks=c(0.01,0.1,1,2,4),
xlab="\nOdds ratio with 95% confidence interval\n(1=no effect, <1=treatment has fewer deaths)",
col=meta.colors(box="royalblue",line="darkblue", summary="royalblue"))
dev.off()
|

|
Cette œuvre est un logiciel libre ; vous pouvez le redistribuer et/ou le modifier selon les termes de la Licence publique générale GNU telle que publiée par la Free Software Foundation ; version 2. Cette œuvre est distribuée dans l'espoir qu'elle soit utile, mais SANS AUCUNE GARANTIE ; sans même de garanties implicites de COMMERCIABILITÉ et de CONFORMITÉ À UNE UTILISATION PARTICULIÈRE. Voir la version 2 de la Licence publique générale GNU pour plus de détails. |
Historique du fichier
Cliquer sur une date et heure pour voir le fichier tel qu'il était à ce moment-là.
| Date et heure | Vignette | Dimensions | Utilisateur | Commentaire | |
|---|---|---|---|---|---|
| actuel | 21 octobre 2017 à 20:00 | | 684 × 309 (95 kio) | HLHJ (d | contributions) | Took out background and cropped using Inkscape |
| 21 octobre 2017 à 18:13 |  | 810 × 391 (63 kio) | HLHJ (d | contributions) | User created page with UploadWizard |
Vous ne pouvez pas remplacer ce fichier.
Utilisations locales du fichier
Aucune page n’utilise ce fichier.
Utilisations du fichier sur d’autres wikis
Les autres wikis suivants utilisent ce fichier :
- Utilisation sur en.wikipedia.org
- Utilisation sur fr.wikipedia.org
- Utilisation sur he.wikipedia.org
- Utilisation sur ja.wikipedia.org
- Utilisation sur pl.wikipedia.org
- Utilisation sur zh.wikipedia.org