File:Price-of-electricity-new-renewables-vs-new-fossil-no-geo.png

Original file (2,426 × 3,747 pixels, file size: 362 KB, MIME type: image/png)
Captions
Captions
Summary
[edit]
| Description |
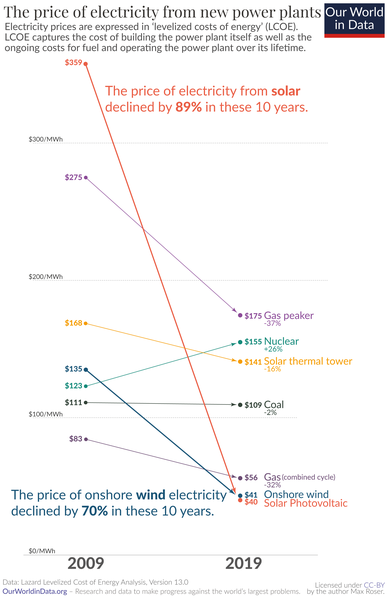
English: The price decline of electricity from renewable sources
If we want to transition to renewables, it is their price relative to fossil fuels that matters. This chart here is identical to the previous one, but now also includes the price of electricity from renewable sources. All of these prices – renewables as well as fossil fuels – are without subsidies. Look at the change in solar and wind energy in recent years. Just 10 years ago it wasn’t even close: it was much cheaper to build a new power plant that burns fossil fuels than to build a new solar photovoltaic (PV) or wind plant. Wind was 22%, and solar 223% more expensive than coal. But in the last few years this has changed entirely. Electricity from utility-scale solar photovoltaics cost $359 per MWh in 2009. Within just one decade the price declined by 89% and the relative price flipped: the electricity price that you need to charge to break even with the new average coal plant is now much higher than what you can offer your customers when you build a wind or solar plant. It’s hard to overstate what a rare achievement these rapid price changes represent. Imagine if some other good had fallen in price as rapidly as renewable electricity: Imagine you’d found a great place to live back in 2009 and at the time you thought it’d be worth paying $3590 in rent for it. If housing had then seen the price decline that we’ve seen for solar it would have meant that by 2019 you’d pay just $400 for the same place. I emphasized that it is the relative price that matters for the decision of which type of power plants are built. Did the price decline of renewables matter for the decisions of actual power plant builders in recent years? Yes it did. As you see in our Energy Explorer, wind and solar energy were scaled up rapidly in recent years; in 2019 renewables accounted for 72% of all new capacity additions worldwide. |
| Date | |
| Source | https://ourworldindata.org/cheap-renewables-growth |
| Author | Our World In Data - Max Roser |
Licensing
[edit]
- You are free:
- to share – to copy, distribute and transmit the work
- to remix – to adapt the work
- Under the following conditions:
- attribution – You must give appropriate credit, provide a link to the license, and indicate if changes were made. You may do so in any reasonable manner, but not in any way that suggests the licensor endorses you or your use.
- share alike – If you remix, transform, or build upon the material, you must distribute your contributions under the same or compatible license as the original.
File history
Click on a date/time to view the file as it appeared at that time.
| Date/Time | Thumbnail | Dimensions | User | Comment | |
|---|---|---|---|---|---|
| current | 17:07, 3 June 2021 | | 2,426 × 3,747 (362 KB) | PJ Geest (talk | contribs) | Uploaded a work by Our World In Data - Max Roser from https://ourworldindata.org/cheap-renewables-growth with UploadWizard |
You cannot overwrite this file.
File usage on Commons
There are no pages that use this file.
File usage on other wikis
The following other wikis use this file:
- Usage on de.wikipedia.org
- Usage on en.wikipedia.org
Metadata
- Our World in Data - Energy and Environment
- Our World in Data - Innovation and Technological Change
- Renewable energy statistics
- Economics and climate change
- Nuclear power statistics
- Economics studies of 2020
- Energy costs
- Charts showing data through 2019
- Correlation and combination datagraphics by Our World in Data