File:Puglini 2020 laptev.png
Jump to navigation
Jump to search

Size of this preview: 596 × 599 pixels. Other resolutions: 239 × 240 pixels | 477 × 480 pixels | 764 × 768 pixels | 1,019 × 1,024 pixels | 2,067 × 2,078 pixels.
Original file (2,067 × 2,078 pixels, file size: 482 KB, MIME type: image/png)
Captions
Captions
Add a one-line explanation of what this file represents

|
This file was moved to Wikimedia Commons from en.wikipedia using a bot script. All source information is still present. It requires review. Additionally, there may be errors in any or all of the information fields; information on this file should not be considered reliable and the file should not be used until it has been reviewed and any needed corrections have been made. Once the review has been completed, this template should be removed. For details about this file, see below. Check now! |
Summary
[edit]
| Description |
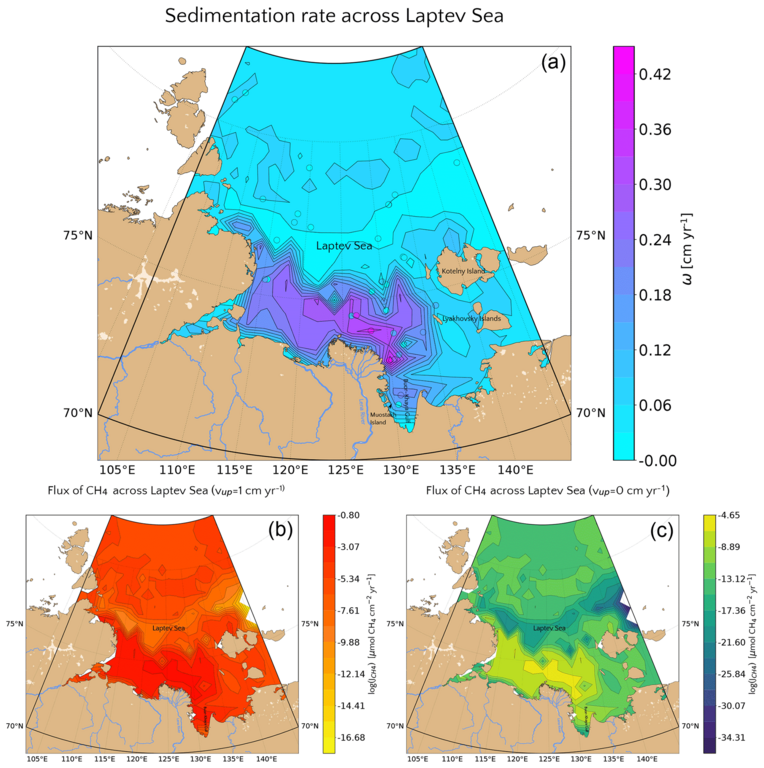
English: This graphic from Puglini 2020 shows the rate of sedimentation in the Laptev Sea (top), which is a key varible controlling methane flux rates, regardless of the absence or presence of upward flow (left, right). |
| Date | 6 July 2023 (original upload date) |
| Source | Transferred from en.wikipedia to Commons. |
| Author | The original uploader was InformationToKnowledge at English Wikipedia. |
| Permission (Reusing this file) |
CC-BY-4.0. |
Licensing
[edit]
This file is licensed under the Creative Commons Attribution 4.0 International license.
- You are free:
- to share – to copy, distribute and transmit the work
- to remix – to adapt the work
- Under the following conditions:
- attribution – You must give appropriate credit, provide a link to the license, and indicate if changes were made. You may do so in any reasonable manner, but not in any way that suggests the licensor endorses you or your use.
Original upload log
[edit]
The original description page was here. All following user names refer to en.wikipedia.
| Date/Time | Dimensions | User | Comment |
|---|---|---|---|
| 2023-07-06 15:44 | 2067×2078× (493112 bytes) | InformationToKnowledge | This graphic from [https://bg.copernicus.org/articles/17/3247/2020/ Puglini 2020] shows the rate of [[sedimentation]] in the [[Laptev Sea]] (top), which is a key varible controlling [[methane]] flux rates, regardless of the absence or presence of upward flow (left, right). |

|
This media file is uncategorized.
Please help improve this media file by adding it to one or more categories, so it may be associated with related media files (how?), and so that it can be more easily found.
Please notify the uploader with {{subst:Please link images|File:Puglini 2020 laptev.png}} ~~~~ |
File history
Click on a date/time to view the file as it appeared at that time.
| Date/Time | Thumbnail | Dimensions | User | Comment | |
|---|---|---|---|---|---|
| current | 04:56, 30 December 2023 | | 2,067 × 2,078 (482 KB) | Nkfj103 (talk | contribs) | Transferred from en.wikipedia via #commonshelper |
You cannot overwrite this file.
File usage on Commons
There are no pages that use this file.
File usage on other wikis
The following other wikis use this file:
- Usage on en.wikipedia.org