File:Radiocarbon bomb spike.svg
跳转到导航
跳转到搜索

此SVG文件的PNG预览的大小:600 × 480像素。 其他分辨率:300 × 240像素 | 960 × 768像素 | 1,280 × 1,024像素 | 2,560 × 2,048像素。
原始文件 (SVG文件,尺寸为600 × 480像素,文件大小:27 KB)
说明
说明
添加一行文字以描述该文件所表现的内容
| 描述 |
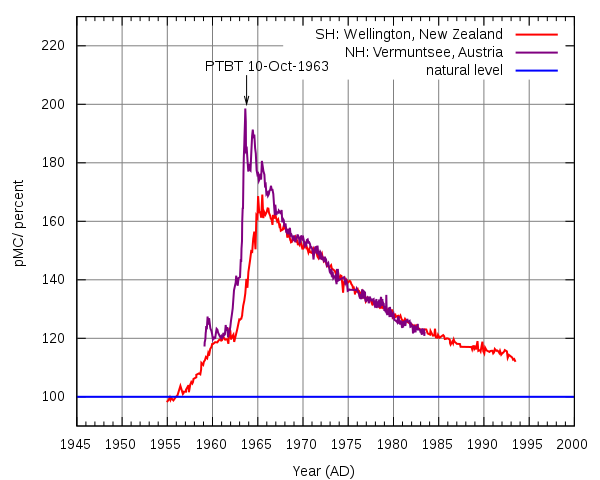
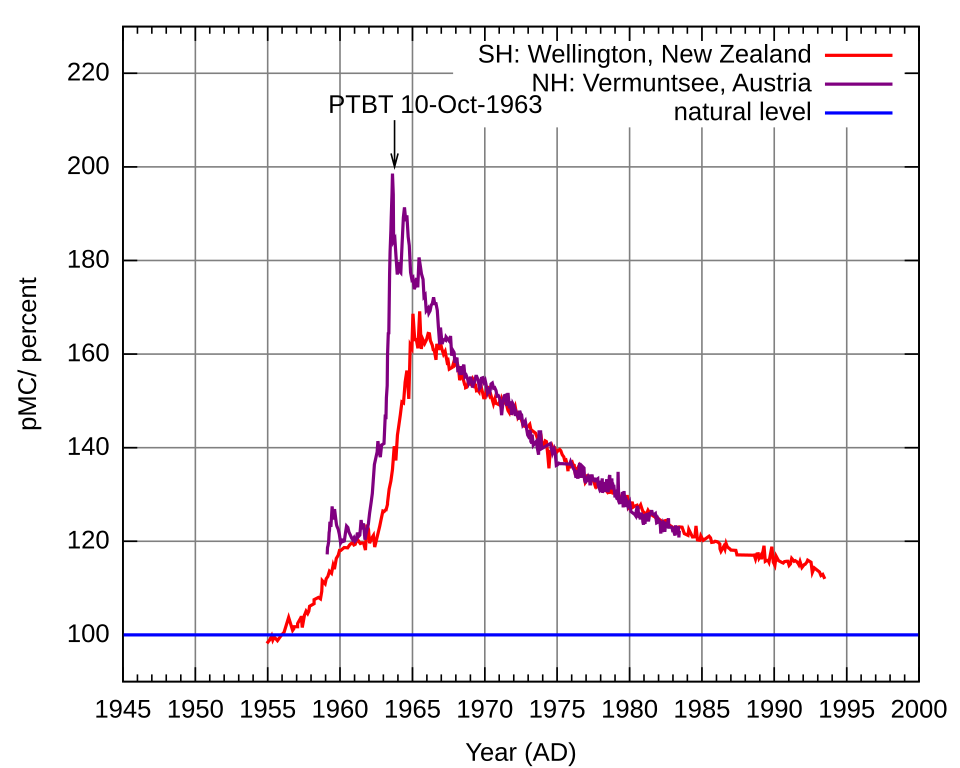
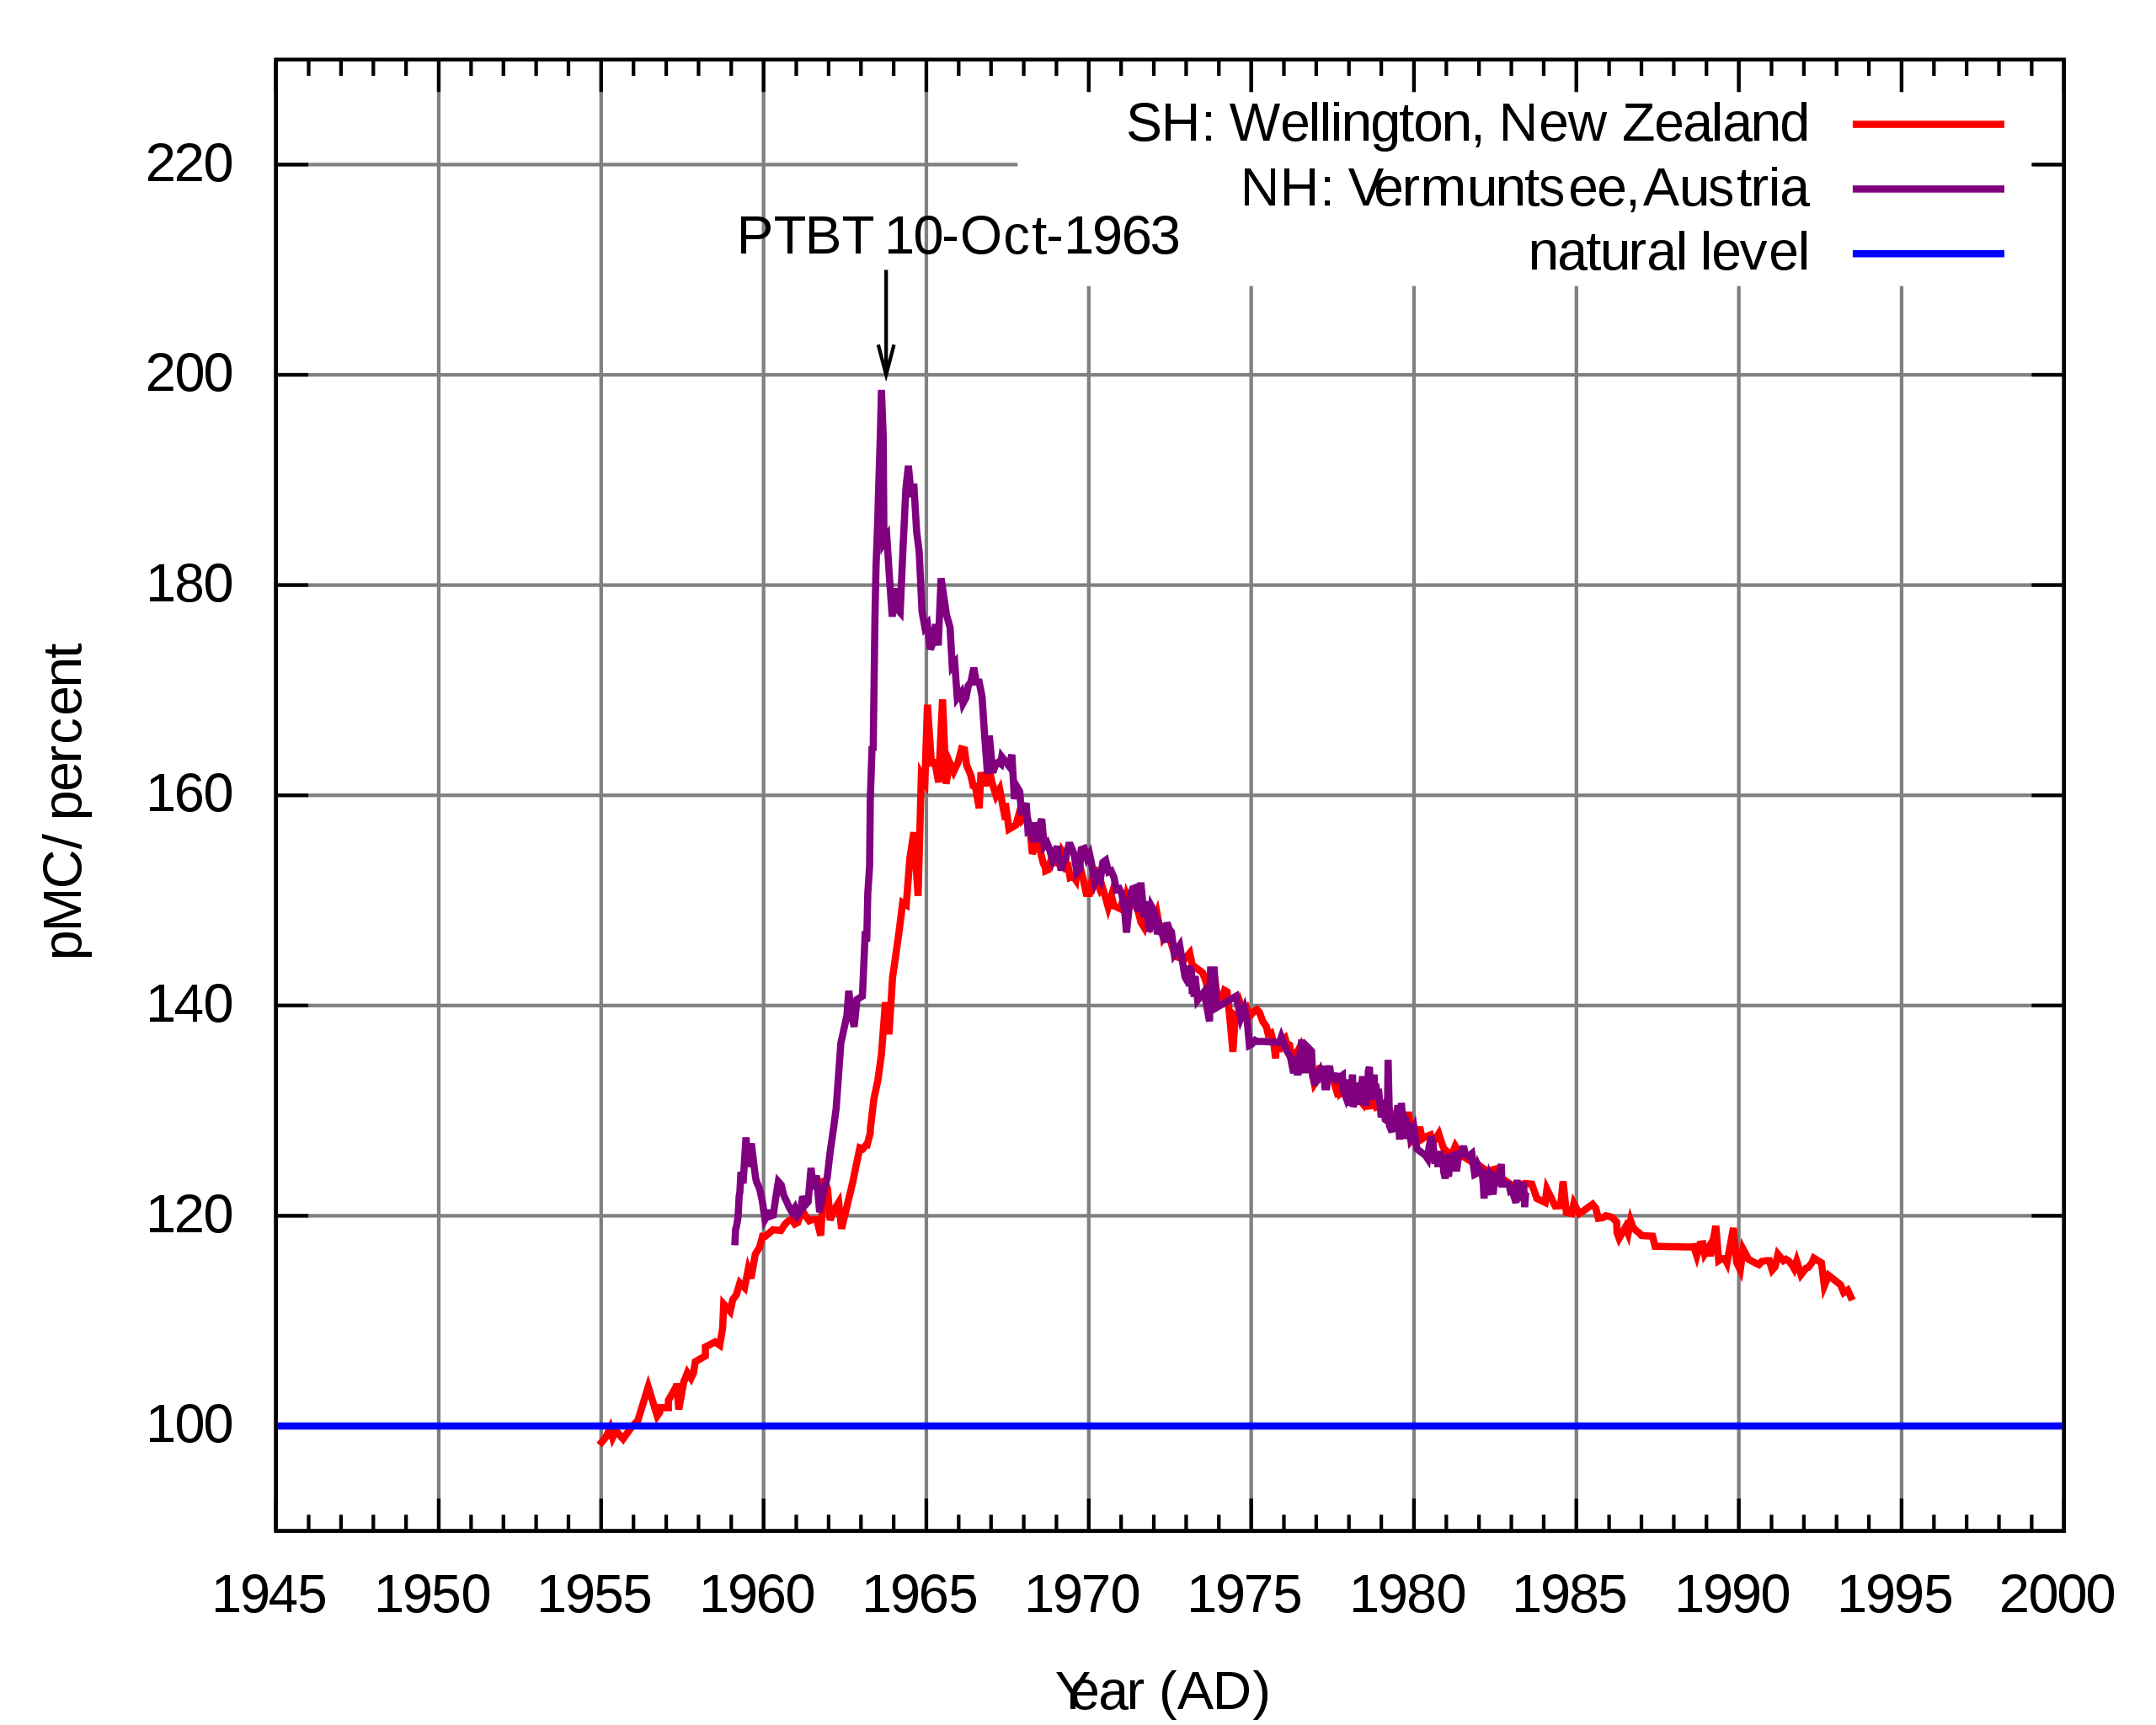
English: Atmospheric 14CO2 in the second half of the 20th century.
The figure shows the 14C / 12C ratio relative to the natural level in the atmospheric CO2 as a function of time in the second half of the 20th century. The plot was generated with gnuplot from data of atmospheric radiocarbon in Wellington, New Zealand 1954AD to 1993AD and at the Vermuntsee, Austria 1959AD to 1983AD. The SVG file from gnuplot has been improved manually. The data sources provide the data as D14C. For the plot the absolute percent modern value has been calculated assuming that each measurement was done in the same year as the respective sample was taken.Deutsch: Atmosphärisches 14CO2 in der zweiten Hälfte des 20. Jahrhunderts. |
||
| 日期 | AD 2008-08-09 | ||
| 来源 |
自己的作品 (原始文本: Own work. Data from the following sources:)
|
||
| 作者 | Hokanomono | ||
| 授权 (二次使用本文件) |
All rights for generating the graphics shall be released. As far as I know there is no copyright protection on measurement data in general.
|
||
| 其他版本 |
|
||
| SVG开发 | |||
| 源代码 | Gnuplot codereset
set term svg enhanced
set output "plot.svg"
set xdata time
set timefmt "%Y-%m-%d"
set xrange ["1945-1-1":"2000-1-1"]
set format x "%Y"
set xtics 5*31556926
set grid
#set title 'Atmospheric ^{14}CO_{2}'
set xlabel 'Year (AD)'
set ylabel 'pMC/ percent'
#see Stuiver Polach for conversion between D14C and pMC
lambda = 1.0 / (8267 * 365.2422 * 24 * 3600)
set arrow from "1963-10-10", 210 to "1963-10-10", 200
set label "PTBT 10-Oct-1963" at "1963-10-10", 210 offset -5,0.5
plot [][90:230] "<awk '!/*/{print \"19\" $1 \"-\" $2 \"-\" $3, mktime(sprintf(\"19%02i %02i %02i 00 00 00\", $1, $2, $3)) - mktime(\"1950 01 01 00 00 00\"), $6, $7;}' welling.195" us 1:(($3+1000)*exp(-lambda*$2)*0.1) tit 'SH: Wellington, New Zealand' w lines, "<awk 'BEGIN{FIELDWIDTHS=\"1 7 5 7 5 2 3 3 4 2 3 3 5 6 5 4 3 2 1\";} /^ HD-/{a = mktime(sprintf(\"19%02i %02i %02i 00 00 00\", $8, $7, $6)); b = mktime(sprintf(\"19%02i %02i %02i 00 00 00\", $12, $11, $10)); present=mktime(\"1950 01 01 00 00 00\"); printf \"%s %g %4g %2g\\n\", strftime(\"%Y-%m-%d\", (a+b)/2), (b-a)/2, b-present, $16, $18;}' vermunt.c14" us 1:(($4+1000)*exp(-lambda*$3)*0.1) tit 'NH: Vermunt, Austria' w lines, 100 tit 'natural level'
set output
|

文件历史
点击某个日期/时间查看对应时刻的文件。
| 日期/时间 | 缩略图 | 大小 | 用户 | 备注 | |
|---|---|---|---|---|---|
| 当前 | 2015年4月10日 (五) 14:32 | | 600 × 480(27 KB) | Hokanomono(留言 | 贡献) | Increase line width. |
| 2015年4月9日 (四) 08:43 |  | 600 × 480(27 KB) | Hokanomono(留言 | 贡献) | Change green line to purple. | |
| 2011年4月5日 (二) 20:09 |  | 600 × 480(27 KB) | Hokanomono(留言 | 贡献) | Changed “Vermunt” to “Vermuntsee”. | |
| 2008年8月9日 (六) 13:30 |  | 600 × 480(27 KB) | Hokanomono(留言 | 贡献) | {{Information |Description= |Source= |Date= |Author= |Permission= |other_versions= }} | |
| 2006年3月14日 (二) 22:27 |  | 600 × 480(21 KB) | Hokanomono(留言 | 贡献) | This is a new version of Media:Atmospheric radiocarbon 1954-1993.svg. I have changed the title because I'm using additional data sources now. |
您不可以覆盖此文件。
文件用途
以下页面使用本文件:
全域文件用途
以下其他wiki使用此文件:
- be.wikipedia.org上的用途
- bg.wikipedia.org上的用途
- ca.wikipedia.org上的用途
- cs.wikipedia.org上的用途
- cv.wikipedia.org上的用途
- da.wikipedia.org上的用途
- de.wikipedia.org上的用途
- Radiokarbonmethode
- Kernwaffen-Effekt
- Vertrag über das Verbot von Kernwaffenversuchen in der Atmosphäre, im Weltraum und unter Wasser
- Portal:Chemie/Übersicht Lesenswerte Artikel
- Portal:Chemie/Artikelauszug/Radiokohlenstoffdatierung
- Diskussion:Radiokarbonmethode/Archiv/1
- Salted Bomb
- Portal:Physik/Artikel des Monats 2018-09
- Wikipedia Diskussion:Hauptseite/Artikel des Tages/Archiv/Vorschläge/2021/Q4
- Wikipedia:Hauptseite/Archiv/26. Dezember 2021
- en.wikipedia.org上的用途
- Background radiation
- Partial Nuclear Test Ban Treaty
- Nuclear fallout
- Carbon-14
- Radioactive contamination
- User talk:Hokanomono
- Wikipedia:Reference desk/Archives/Science/2009 January 3
- User:Boundarylayer/sandbox
- Bomb pulse
- Wikipedia:WikiProject Wikipack Africa Content/Wikipedia:Showcase
- Wikipedia:WikiProject WikiFundi Content/Radiocarbon dating
- Wikipedia:WikiProject WikiFundi Content/Wikipedia:Showcase
- eo.wikipedia.org上的用途
- es.wikipedia.org上的用途
- et.wikipedia.org上的用途
- fr.wikipedia.org上的用途
- he.wikipedia.org上的用途
- hi.wikipedia.org上的用途
- hr.wikipedia.org上的用途
- hu.wikipedia.org上的用途
- hy.wikipedia.org上的用途
- it.wikipedia.org上的用途
查看此文件的更多全域用途。