File:Ramseypic.svg
跳至導覽
跳至搜尋

此 SVG 檔案的 PNG 預覽的大小:400 × 400 像素。 其他解析度:240 × 240 像素 | 480 × 480 像素 | 768 × 768 像素 | 1,024 × 1,024 像素 | 2,048 × 2,048 像素。
原始檔案 (SVG 檔案,表面大小:400 × 400 像素,檔案大小:27 KB)
說明
說明
添加單行說明來描述出檔案所代表的內容
| 描述 |
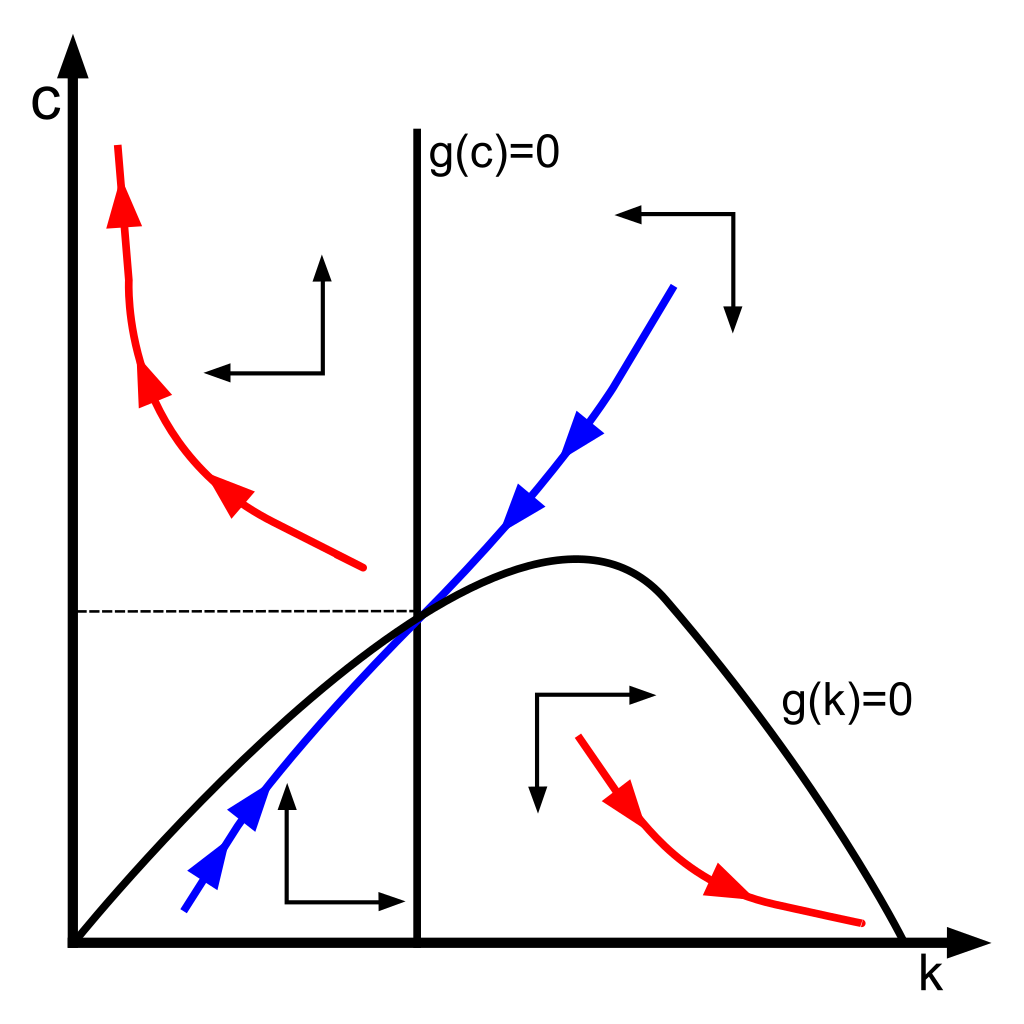
English: Ramsey growth model graph. The blue line represents the dynamic adjustment path of the economy. It is a stable path of the dynamic system. The red lines represent dynamic paths which are ruled out by the transversality condition.
Español: Gráfica del modelo de crecimiento de Ramsey. La línea azul representa la trayectoria del ajuste dinámico de la economía. Es una ruta estable del sistema dinámico. Las líneas rojas representan trayectorias dinámicas que se rigen por la condición de transversalidad. |
| 日期 | (UTC) |
| 來源 | |
| 作者 |
|
我,本作品的著作權持有者,決定用以下授權條款發佈本作品:
| 此作品已由其作者,英文維基百科的[[Wikipedia:User:英文維基百科的[[Wikipedia:User:{{{1}}}|{{{1}}}]]|英文維基百科的[[Wikipedia:User:{{{1}}}|{{{1}}}]]]],釋出至公有領域。此授權條款在全世界均適用。 這可能在某些國家不合法,如果是的話: [[:Wikipedia:en:User:[[:Wikipedia:en:User:{{{1}}}|{{{1}}}]]|[[:Wikipedia:en:User:{{{1}}}|{{{1}}}]]]]授予任何人有權利使用此作品於任何用途,除受法律約束外,不受任何限制。 |
| |
此作品已由其作者,[[::|中文維基百科]]專案的Example,釋出至公有領域。此授權條款在全世界均適用。 如果法律不適用時: |
您可以選擇您需要的授權條款。
原始上傳日誌
[編輯]
This image is a derivative work of the following images:
- File:Ramseypic-es.png licensed with PD-user-en, PD-user-w
- 2011-01-01T19:53:16Z Dalton2 2000x1800 (119465 Bytes) {{Information |Description=Ramsey growth model graph/Gráfica del modelo de crecimiento Ramsey |Source=http://en.wikipedia.org/wiki/File:Ramseypic.JPG |Date=1/1/2011 |Author=Volunteer Marek (original version), Dalton2 (new ve
Uploaded with derivativeFX
檔案歷史
點選日期/時間以檢視該時間的檔案版本。
| 日期/時間 | 縮圖 | 尺寸 | 使用者 | 備註 | |
|---|---|---|---|---|---|
| 目前 | 2011年1月1日 (六) 21:51 | | 400 × 400(27 KB) | Rondador(留言 | 貢獻) | ¿? |
| 2011年1月1日 (六) 21:49 |  | 400 × 400(27 KB) | Rondador(留言 | 貢獻) | Fixed transparency. | |
| 2011年1月1日 (六) 21:41 |  | 400 × 400(35 KB) | Rondador(留言 | 貢獻) | {{Information |Description={{en|1=Ramsey growth model graph. The blue line represents the dynamic adjustment path of the economy. It is a stable path of the dynamic system. The red lines represent dynamic paths which are ruled out by the transversality co |
無法覆蓋此檔案。
檔案用途
下列頁面有用到此檔案:
全域檔案使用狀況
以下其他 wiki 使用了這個檔案:
- de.wikipedia.org 的使用狀況
- en.wikipedia.org 的使用狀況
- es.wikipedia.org 的使用狀況
- pl.wikipedia.org 的使用狀況
- vi.wikipedia.org 的使用狀況
- zh.wikipedia.org 的使用狀況