File:Satellite Temperatures.png
Przejdź do nawigacji
Przejdź do wyszukiwania

Rozmiar podglądu – 800 × 530 pikseli. Inne rozdzielczości: 320 × 212 pikseli | 640 × 424 pikseli | 1024 × 678 pikseli | 1280 × 848 pikseli | 2400 × 1590 pikseli.
Rozmiar pierwotny (2400 × 1590 pikseli, rozmiar pliku: 297 KB, typ MIME: image/png)
Podpisy
Podpisy
Dodaj jednolinijkowe objaśnienie tego, co ten plik pokazuje
| Opis |
 
|
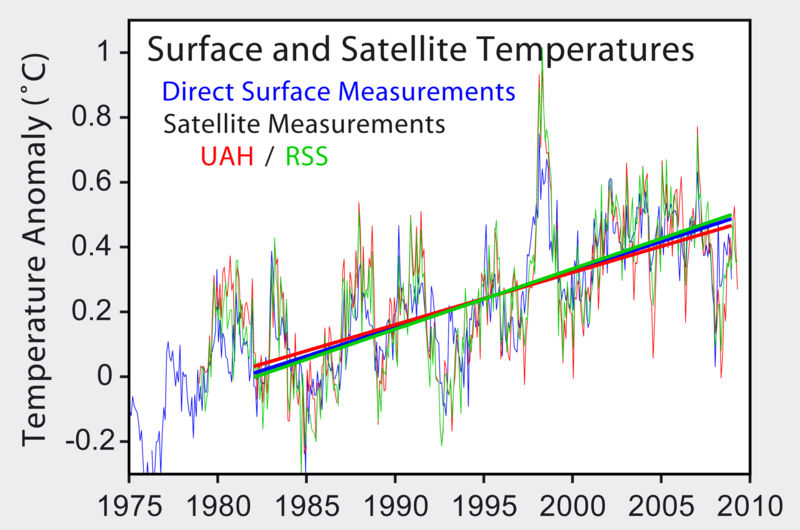
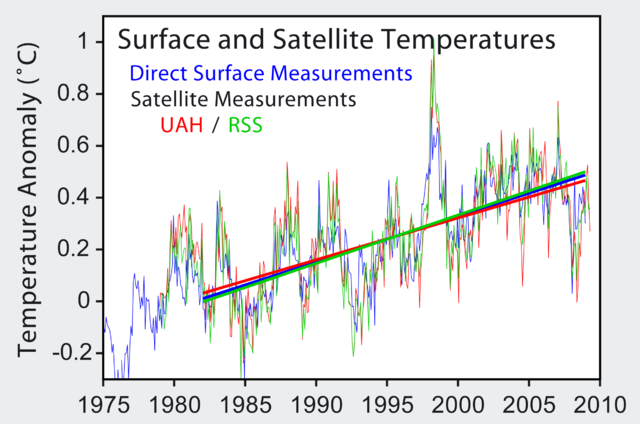
| Źródło | http://www.cru.uea.ac.uk/cru/data/temperature/ |
| Autor | Robert A. Rohde |
Opis ==
Image from Global Warming Art
This image is an original work created for Global Warming Art. Please refer to the image description page for more information.

|
Udziela się zgody na kopiowanie, rozpowszechnianie oraz modyfikowanie tego dokumentu zgodnie z warunkami GNU Licencji Wolnej Dokumentacji, w wersji 1.2 lub nowszej opublikowanej przez Free Software Foundation; bez niezmiennych sekcji, bez treści umieszczonych na frontowej lub tylnej stronie okładki. Kopia licencji załączona jest w sekcji zatytułowanej GNU Licencja Wolnej Dokumentacji. |
| Ten plik udostępniony jest na licencji Creative Commons Uznanie autorstwa – Na tych samych warunkach 3.0. | ||
| ||
| Ten szablon został dodany jako element zmiany licencjonowania. |
Historia pliku
Kliknij na odpowiedniej dacie/czasie, aby zobaczyć wersję pliku z tamtego okresu.
| Data/czas | Miniatura | Wymiary | Użytkownik | Opis | |
|---|---|---|---|---|---|
| aktualny | 20:30, 31 lip 2009 | | 2400 × 1590 (297 KB) | Dragons flight (dyskusja | edycje) | update |
| 07:10, 10 kwi 2006 |  | 512 × 363 (30 KB) | Pflatau (dyskusja | edycje) |
Nie możesz nadpisać tego pliku.
Lokalne wykorzystanie pliku
Poniższa strona korzysta z tego pliku:
Globalne wykorzystanie pliku
Ten plik jest wykorzystywany także w innych projektach wiki:
- Wykorzystanie na ca.wikipedia.org
- Wykorzystanie na de.wikipedia.org
- Wykorzystanie na en.wikipedia.org
- Satellite temperature measurement
- Leipzig Declaration
- User:Dragons flight/Images
- Temperature measurement
- User:C-randles
- Friends of Science
- Talk:Friends of Science
- User:Debnigo
- File talk:Satellite Temperatures.png
- User:Merlinme/Sandbox
- Microwave Sounding Unit temperature measurements
- Wikipedia:Reference desk/Archives/Science/2011 June 13
- User talk:Sailsbystars/Archive 2
- Wykorzystanie na es.wikipedia.org
- Wykorzystanie na fa.wikipedia.org
- Wykorzystanie na fr.wikipedia.org
- Wykorzystanie na ko.wikipedia.org
- Wykorzystanie na pl.wikipedia.org
- Wykorzystanie na pt.wikipedia.org