File:Spectral views of zero-fill and interpolation by lowpass filtering.pdf
跳转到导航
跳转到搜索

此PDF文件的JPG预览的大小:680 × 600像素。 其他分辨率:272 × 240像素 | 544 × 480像素 | 871 × 768像素 | 1,161 × 1,024像素 | 1,743 × 1,537像素。
原始文件 (1,743 × 1,537像素,文件大小:101 KB,MIME类型:application/pdf)
说明
说明
添加一行文字以描述该文件所表现的内容
摘要[编辑]
| 描述 |
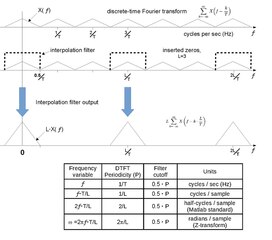
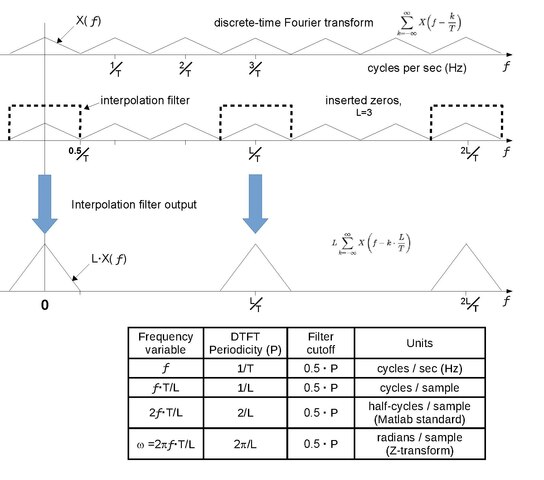
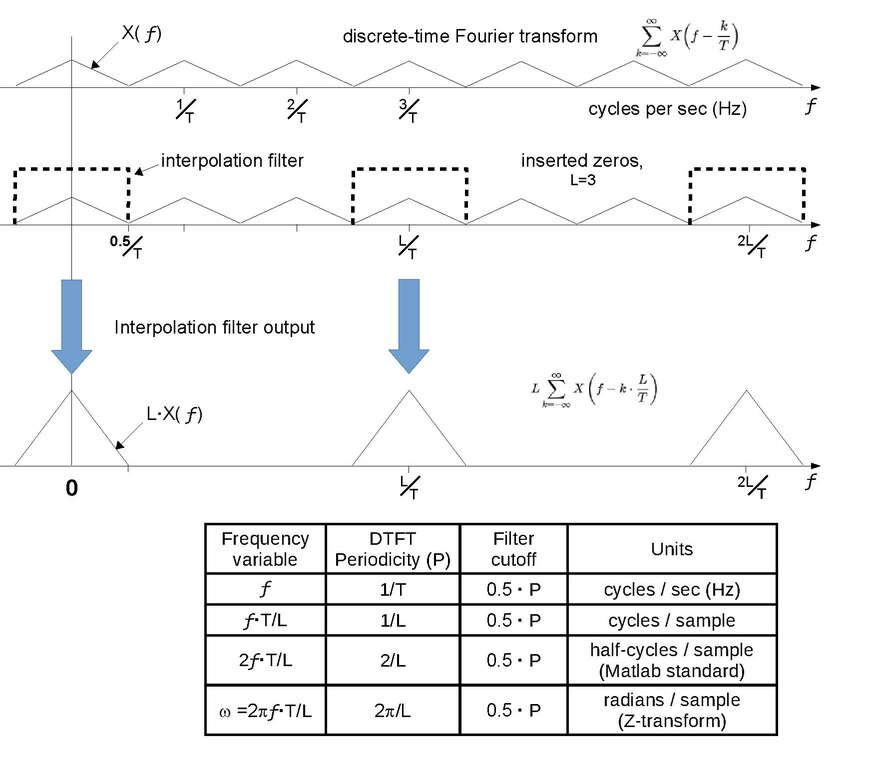
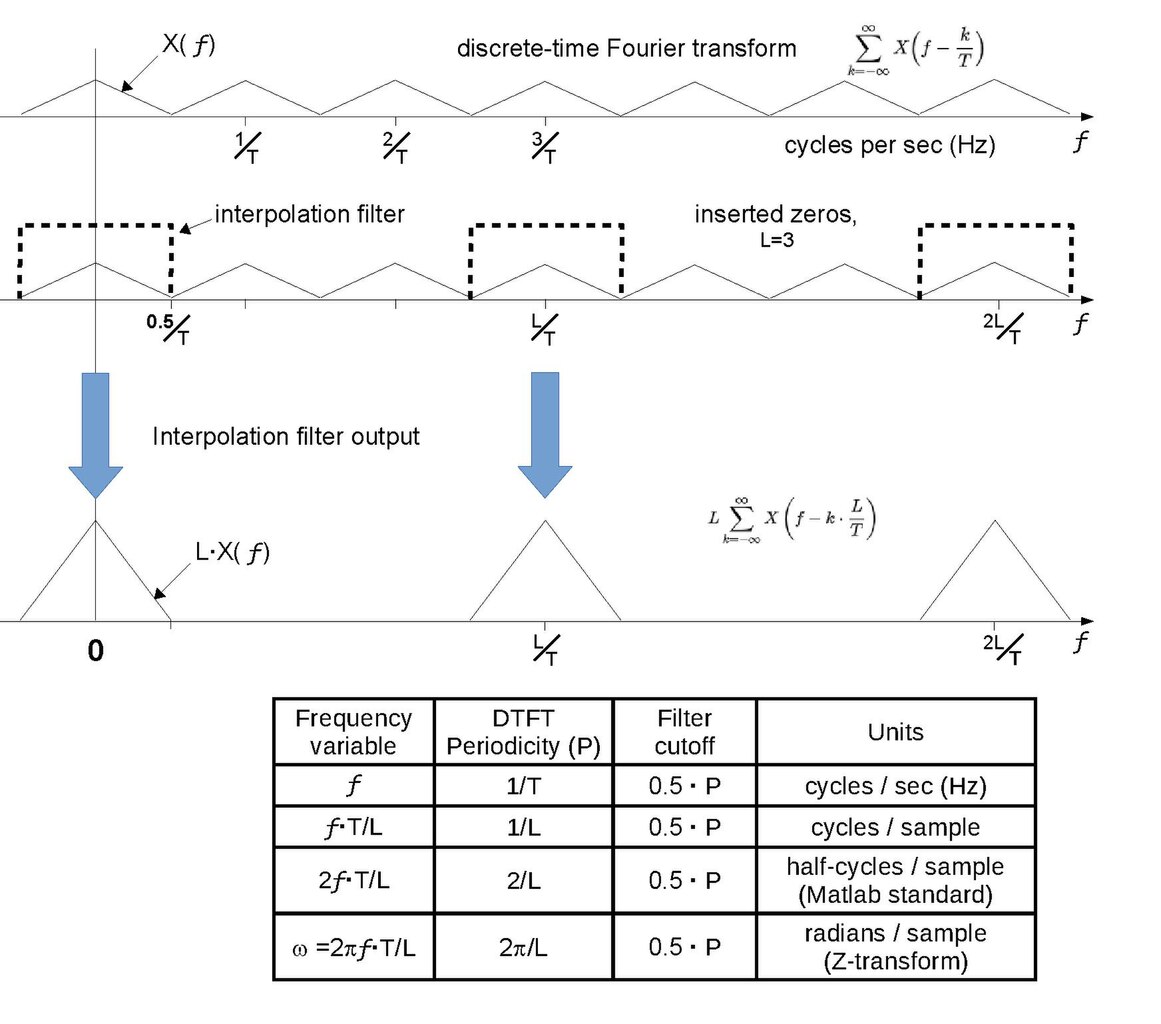
English: The first and third graphs depict the discrete-time Fourier transforms of a sampled function and the same function sampled 3 times faster. The second graph shows the transform of a sequence derived from the low-rate samples by inserting 2 zeros in-between each pair of real samples. It is identical to the first graph, except the numeral 3 is replaced by symbol L. A lowpass filter with bandwidth 0.5/T is also depicted. When applied to the zero-inserted sequence, its spectral output resembles the third graph, which is the desired result of interpolation. The maximum filter bandwidth is tabulated in the bandwidth units used by the common filter design applications. |
|||
| 日期 | ||||
| 来源 | 自己的作品. The first and second graphs correspond to the first and third graphs of Harris[1], Figure 2.12, except the upsample rates are different (3 and 5) | |||
| 作者 | Bob K | |||
| 授权 (二次使用本文件) |
我,本作品著作权人,特此采用以下许可协议发表本作品:
|
|||
| 其他版本 |
此文件衍生的作品: Spectral views of zero-fill and interpolation by lowpass filtering.svg The current svg file renders the rectangular lowpass filter incorrectly. It should be a dashed line, not a solid line.
|
|||
| References |
|


文件历史
点击某个日期/时间查看对应时刻的文件。
| 日期/时间 | 缩略图 | 大小 | 用户 | 备注 | |
|---|---|---|---|---|---|
| 当前 | 2024年3月25日 (一) 20:12 |  | 1,743 × 1,537(101 KB) | Bob K(留言 | 贡献) | Remove accidental (blank) second page. |
| 2024年3月24日 (日) 23:08 | 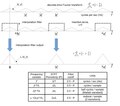 | 1,743 × 1,537,2页(101 KB) | Bob K(留言 | 贡献) | Changed a label and a column header in the table. | |
| 2020年1月5日 (日) 15:22 | 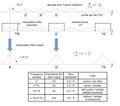 | 1,743 × 1,537(69 KB) | Bob K(留言 | 贡献) | same frequency scale for all 3 graphs | |
| 2020年1月3日 (五) 15:50 | 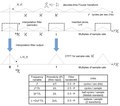 | 1,743 × 1,537(67 KB) | Bob K(留言 | 贡献) | minor improvements | |
| 2020年1月3日 (五) 02:51 | 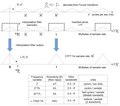 | 1,743 × 1,537(67 KB) | Bob K(留言 | 贡献) | modify the table | |
| 2019年12月31日 (二) 02:51 | 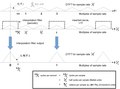 | 1,743 × 1,289(54 KB) | Bob K(留言 | 贡献) | replace Z-transform graphs with table showing various units of bandwidth | |
| 2014年1月20日 (一) 23:49 | 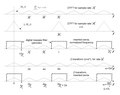 | 1,800 × 1,425(36 KB) | Bob K(留言 | 贡献) | Remove accidental (blank) second page. | |
| 2014年1月20日 (一) 23:37 |  | 1,800 × 1,425,2页(37 KB) | Bob K(留言 | 贡献) | User created page with UploadWizard |
您不可以覆盖此文件。
文件用途
以下2个页面使用本文件:
全域文件用途
以下其他wiki使用此文件:
- en.wikipedia.org上的用途
- zh.wikipedia.org上的用途