File:Standard deviation.svg
Jump to navigation
Jump to search

Size of this PNG preview of this SVG file: 512 × 411 pixels. Other resolutions: 299 × 240 pixels | 598 × 480 pixels | 957 × 768 pixels | 1,276 × 1,024 pixels | 2,551 × 2,048 pixels.
Original file (SVG file, nominally 512 × 411 pixels, file size: 12 KB)
Captions
Captions
Add a one-line explanation of what this file represents
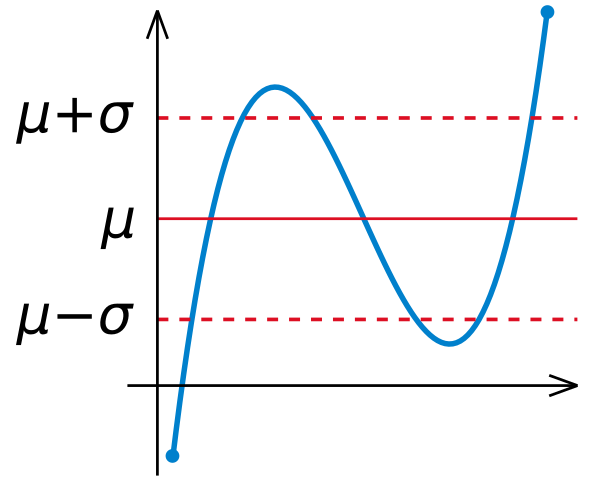
| Description | Illustration of en:Standard deviation |
| Date | (UTC) |
| Source | self-made with MATLAB. Tweaked in Inkscape |
| Author | Oleg Alexandrov 04:55, 4 August 2007 (UTC) |
| Permission (Reusing this file) |
PD-self |
| I, the copyright holder of this work, release this work into the public domain. This applies worldwide. In some countries this may not be legally possible; if so: I grant anyone the right to use this work for any purpose, without any conditions, unless such conditions are required by law. |
% Illustartion of standard deviation
function main()
   a=-1.2; b = 1.3;
   c = -0.5; d = 2.5;
   N=100;

   X=linspace(a, b, N);
   Y=X.^3-0.2*X.^2-X+2;
%   Y=X.^2;

   % scale Y to fit in the plotting window
   Y = (Y-min(Y))/(max(Y)-min(Y));
   Y = Y*(d-c)+c;

   mean = sum(Y)/length(Y);
   stdev = sqrt(sum((Y-mean).*(Y-mean))/length(Y));

   figure(1); clf; hold on; axis off; axis equal;

   lw = 3; % linewidth
   lw2 = lw/2;
   lw3 = lw/1.5;
   fs = 30; % font size
   red=[0.867 0.06 0.14];
   blue = [0, 129, 205]/256;
   green = [0, 200,  70]/256;
   black = [0, 0, 0];

   % plot the curves
   shiftl=a-0.1;
   small=0.2;
   plot(X, Y, 'linewidth', lw, 'color', blue);
   plot([shiftl max(X)+small], [mean, mean], 'linewidth', lw2, 'color', red);
   plot([shiftl max(X)+small], [mean, mean]+stdev, 'linewidth', lw3, 'color', red, 'linestyle', '--');
   plot([shiftl max(X)+small], [mean, mean]-stdev, 'linewidth', lw3, 'color', red, 'linestyle', '--');

% plot some balls for beauty
   n = length(X);
   ball_rad = 0.03;
   ball(X(1), Y(1), ball_rad, blue)
   ball(X(n), Y(n), ball_rad, blue)

% axes
   small=0.2;
   arrowsize=0.2; arrow_type=0;
   angle=20; % in degrees

   arrow([shiftl-0.2 0], [b+0.2, 0],             lw2, arrowsize, angle, arrow_type, black)
   arrow([shiftl, min(Y-0.1)], [shiftl, max(Y)], lw2, arrowsize, angle, arrow_type, black)

% text
   small1 = 0.3; small2 = 0.3;
   text(shiftl-small1, mean,  '\mu', 'fontsize', fs)
   text(shiftl-small1-small2, mean+stdev,  '\mu+\sigma', 'fontsize', fs)
   text(shiftl-small1-small2, mean-stdev,  '\mu-\sigma', 'fontsize', fs)
%   H=text(0.1, -0.1,  'x_{n+1}'); set(H, 'fontsize', fs)
%   H=text(0.7, -0.1,  'x_{n}'); set(H, 'fontsize', fs)

% save to disk
   saveas(gcf, 'Standard_deviation.eps', 'psc2')
%   plot2svg('Standard_deviation.svg');

function arrow(start, stop, thickness, arrow_size, sharpness, arrow_type, color)

% Function arguments:
% start, stop:  start and end coordinates of arrow, vectors of size 2
% thickness:    thickness of arrow stick
% arrow_size:   the size of the two sides of the angle in this picture ->
% sharpness:    angle between the arrow stick and arrow side, in degrees
% arrow_type:   1 for filled arrow, otherwise the arrow will be just two segments
% color:        arrow color, a vector of length three with values in [0, 1]

% convert to complex numbers
   i=sqrt(-1);
   start=start(1)+i*start(2); stop=stop(1)+i*stop(2);
   rotate_angle=exp(i*pi*sharpness/180);

% points making up the arrow tip (besides the "stop" point)
   point1 = stop - (arrow_size*rotate_angle)*(stop-start)/abs(stop-start);
   point2 = stop - (arrow_size/rotate_angle)*(stop-start)/abs(stop-start);

   if arrow_type==1 % filled arrow

% plot the stick, but not till the end, looks bad
      t=0.5*arrow_size*cos(pi*sharpness/180)/abs(stop-start); stop1=t*start+(1-t)*stop;
      plot(real([start, stop1]), imag([start, stop1]), 'LineWidth', thickness, 'Color', color);

% fill the arrow
      H=fill(real([stop, point1, point2]), imag([stop, point1, point2]), color);
      set(H, 'EdgeColor', 'none')

   else % two-segment arrow
      plot(real([start, stop]), imag([start, stop]),   'LineWidth', thickness, 'Color', color);
      plot(real([stop, point1]), imag([stop, point1]), 'LineWidth', thickness, 'Color', color);
      plot(real([stop, point2]), imag([stop, point2]), 'LineWidth', thickness, 'Color', color);
   end


function ball(x, y, r, color)
   Theta=0:0.1:2*pi;
   X=r*cos(Theta)+x;
   Y=r*sin(Theta)+y;
   H=fill(X, Y, color);
   set(H, 'EdgeColor', 'none');
File history
Click on a date/time to view the file as it appeared at that time.
| Date/Time | Thumbnail | Dimensions | User | Comment | |
|---|---|---|---|---|---|
| current | 04:55, 4 August 2007 | | 512 × 411 (12 KB) | Oleg Alexandrov (talk | contribs) | {{Information |Description=Illustration of en:Standard deviation |Source=self-made with MATLAB. Tweaked in [:en:Inkscape|Inkscape]] |Date=~~~~~ |Author=~~~~ |Permission=PD-self |other_versions= }} {{PD-self}} Category:Probability theory |
You cannot overwrite this file.
File usage on Commons
There are no pages that use this file.
File usage on other wikis
The following other wikis use this file:
- Usage on ar.wikipedia.org
- Usage on ckb.wikipedia.org
- Usage on fa.wikipedia.org
- Usage on is.wikipedia.org
- Usage on ms.wikipedia.org
- Usage on tr.wikipedia.org
- Usage on ur.wikipedia.org