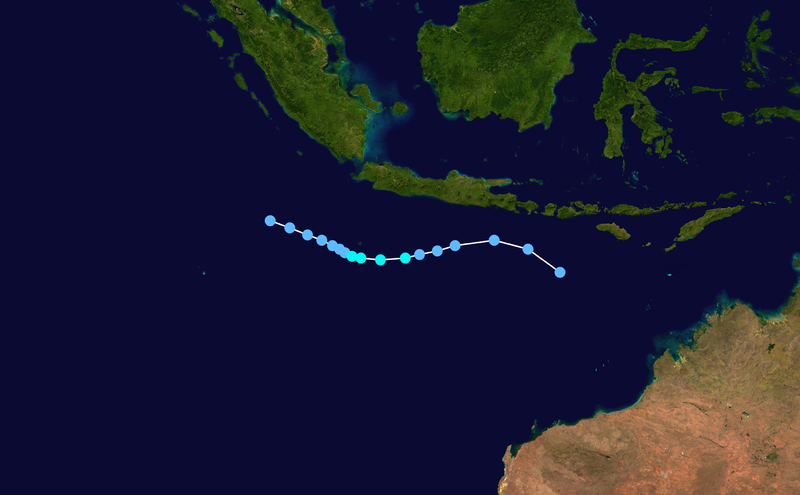
File:Sue 1975 track.png
From Wikimedia Commons, the free media repository
Jump to navigation
Jump to search

Size of this preview: 800 × 495 pixels. Other resolutions: 320 × 198 pixels | 640 × 396 pixels | 1,024 × 633 pixels | 1,280 × 791 pixels | 2,700 × 1,669 pixels.
Original file (2,700 × 1,669 pixels, file size: 1.98 MB, MIME type: image/png)
File information
Structured data
Captions
Captions
Add a one-line explanation of what this file represents
Summary[edit]
| DescriptionSue 1975 track.png |
English: Track map of Tropical Cyclone Sue of the 1975–76 Southern Hemisphere tropical cyclone season. The points show the location of the storm at 6-hour intervals. The colour represents the storm's maximum sustained wind speeds as classified in the Saffir-Simpson Hurricane Scale (see below), and the shape of the data points represent the nature of the storm, according to the legend below.
Storm type |
| Date | |
| Source | The background image is from NASA. Tracking data is from IBTrACS[1]. |
| Author | Supportstorm |
Licensing[edit]
| Public domainPublic domainfalsefalse |
| I, the copyright holder of this work, release this work into the public domain. This applies worldwide. In some countries this may not be legally possible; if so: I grant anyone the right to use this work for any purpose, without any conditions, unless such conditions are required by law. |
File history
Click on a date/time to view the file as it appeared at that time.
| Date/Time | Thumbnail | Dimensions | User | Comment | |
|---|---|---|---|---|---|
| current | 11:44, 7 November 2012 |  | 2,700 × 1,669 (1.98 MB) | Supportstorm (talk | contribs) | == {{int:filedesc}} == {{Information |Description={{en|Track map of Tropical Cyclone Sue of the [[w:http://en.wikipedia.org/wiki/1975%E... |
You cannot overwrite this file.
File usage on Commons
There are no pages that use this file.
File usage on other wikis
The following other wikis use this file:
- Usage on en.wikipedia.org
Metadata
This file contains additional information such as Exif metadata which may have been added by the digital camera, scanner, or software program used to create or digitize it. If the file has been modified from its original state, some details such as the timestamp may not fully reflect those of the original file. The timestamp is only as accurate as the clock in the camera, and it may be completely wrong.
| Horizontal resolution | 28.35 dpc |
|---|---|
| Vertical resolution | 28.35 dpc |