File:TTC39C expression in samples of various human tissues.png
Jump to navigation
Jump to search
No higher resolution available.
TTC39C_expression_in_samples_of_various_human_tissues.png (787 × 343 pixels, file size: 14 KB, MIME type: image/png)
Captions
Captions
Add a one-line explanation of what this file represents
Summary[edit]
| Description |
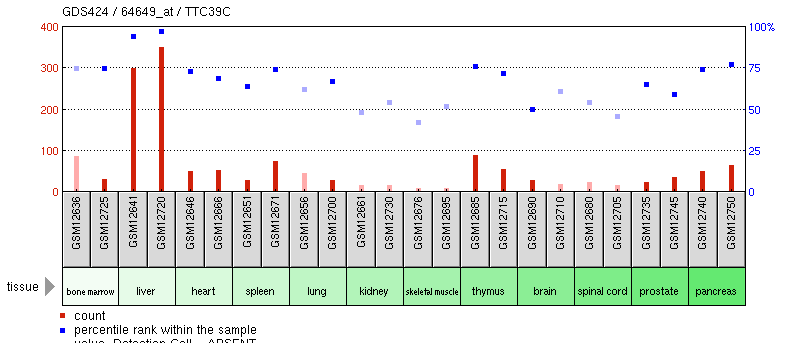
English: This is a graph of TTC39C expression in samples from different human tissues. The bars indicate the quantity of TTC39C in the sample and the dots represent the percentile rank of TTC39C within each sample. |
| Date | |
| Source | https://www.ncbi.nlm.nih.gov/geo/tools/profileGraph.cgi?ID=GDS424:64649_at |
| Author | Affymetrix, Inc |
Licensing[edit]
This image is a work of the National Institutes of Health, part of the United States Department of Health and Human Services, taken or made as part of an employee's official duties. As a work of the U.S. federal government, the image is in the public domain.
 |
||
| This file has been identified as being free of known restrictions under copyright law, including all related and neighboring rights. | ||
File history
Click on a date/time to view the file as it appeared at that time.
| Date/Time | Thumbnail | Dimensions | User | Comment | |
|---|---|---|---|---|---|
| current | 03:38, 4 May 2013 | | 787 × 343 (14 KB) | Hagen566 (talk | contribs) | {{subst:Upload marker added by en.wp UW}} {{Information |Description = {{en|This is a graph of TTC39C expression in samples from different human tissues. The bars indicate the quantity of TTC39C in the sample and the dots represent the percentile rank... |
You cannot overwrite this file.
File usage on Commons
There are no pages that use this file.
File usage on other wikis
The following other wikis use this file:
- Usage on bs.wikipedia.org
- Usage on en.wikipedia.org