File:TentMap BifurcationDiagram.png
Jump to navigation
Jump to search

Size of this preview: 600 × 600 pixels. Other resolutions: 240 × 240 pixels | 480 × 480 pixels | 768 × 768 pixels | 1,254 × 1,254 pixels.
Original file (1,254 × 1,254 pixels, file size: 543 KB, MIME type: image/png)
Captions
Captions
Add a one-line explanation of what this file represents
Summary
[edit]
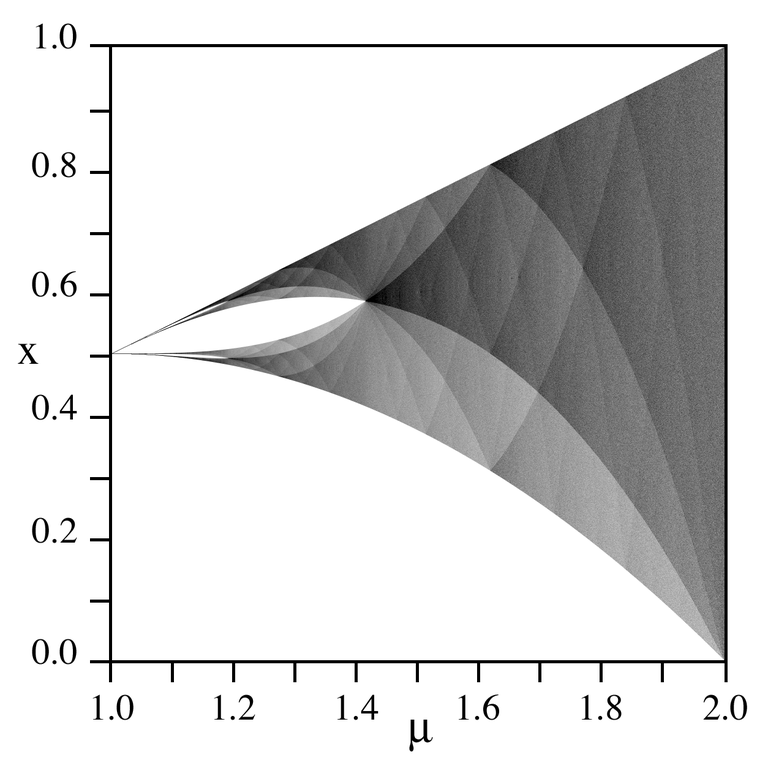
| Description | Bifurcation diagram for the tent map. The horizontal axis is the μ parameter, the vertical axis is the x variable. The image was created by forming a 1000 x 1000 array representing increments of 0.001 in μ and x. A starting value of x=0.25 was used, and the map was iterated 1000 times in order to stabilize the values of x. 100,000 x-values were then calculated for each value of μ and for each x value, the corresponding (x,μ) pixel in the image was incremented by one. All values in a column (corresponding to a particular value of μ) were then multiplied by the number of non-zero pixels in that column, in order to even out the intensities. Finally, values above 180,000 were set to 180,000, and then the entire image was normalized to 0-255. |
| Date | 13 September 2005 (original upload date) |
| Source | No machine-readable source provided. Own work assumed (based on copyright claims). |
| Author | No machine-readable author provided. PAR~commonswiki assumed (based on copyright claims). |
Licensing
[edit]
| I, the copyright holder of this work, release this work into the public domain. This applies worldwide. In some countries this may not be legally possible; if so: I grant anyone the right to use this work for any purpose, without any conditions, unless such conditions are required by law. |
File history
Click on a date/time to view the file as it appeared at that time.
| Date/Time | Thumbnail | Dimensions | User | Comment | |
|---|---|---|---|---|---|
| current | 00:15, 13 September 2005 | | 1,254 × 1,254 (543 KB) | PAR~commonswiki (talk | contribs) | Bifurcation diagram for the tent map. |
You cannot overwrite this file.
File usage on Commons
There are no pages that use this file.
File usage on other wikis
The following other wikis use this file:
- Usage on en.wikipedia.org
- Usage on en.wikiversity.org
- Usage on fr.wikipedia.org
- Usage on ja.wikipedia.org
- Usage on ru.wikipedia.org
- Usage on zh.wikipedia.org