File:Thiel-Sen estimator.svg
跳至導覽
跳至搜尋

此 SVG 檔案的 PNG 預覽的大小:572 × 599 像素。 其他解析度:229 × 240 像素 | 458 × 480 像素 | 733 × 768 像素 | 978 × 1,024 像素 | 1,955 × 2,048 像素 | 2,936 × 3,075 像素。
原始檔案 (SVG 檔案,表面大小:2,936 × 3,075 像素,檔案大小:37 KB)
說明
說明
添加單行說明來描述出檔案所代表的內容
摘要
[編輯]
| 描述 |
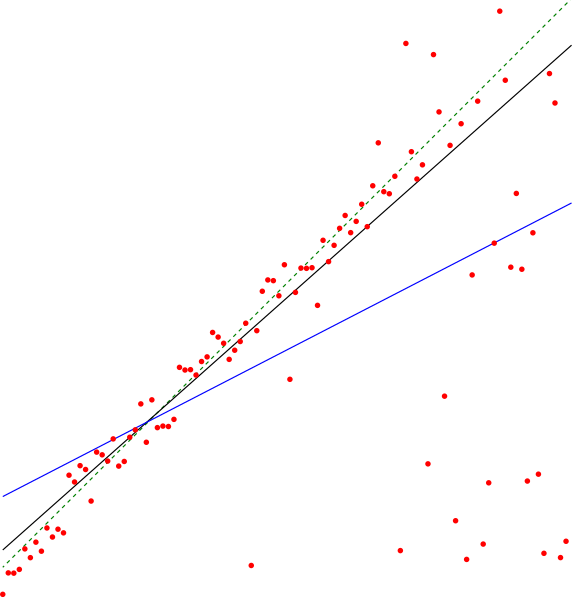
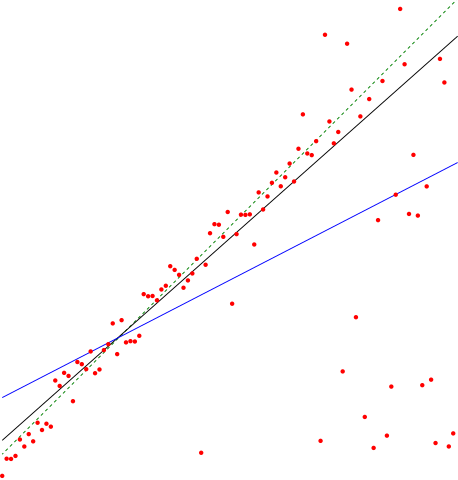
English: The en:Theil–Sen estimator (black line) of a set of sample points, compared to the simple linear regression line (blue). The points were generated by adding a small amount of jitter to points on the green dashed line and then replacing some of the points by random outliers. |
| 日期 | |
| 來源 | 自己的作品 |
| 作者 | David Eppstein |
授權條款
[編輯]
我,本作品的著作權持有者,決定用以下授權條款發佈本作品:
| 此檔案在創用CC CC0 1.0 通用公有領域貢獻宣告之下分發。 | |
| 在此宣告之下分發本作品者,已依據各國著作權法,在全世界放棄其對本作品所擁有的著作權及所有相關相似的法律權利,從而將本作品貢獻至公有領域。您可以複製、修改、分發和演示該作品,用於任何商業用途,所有這些都不需要請求授權。
|
Source code
[編輯]
This image was created as a pdf file by the following Python code, then converted to SVG.
from pyx import canvas,path,color
from random import random,seed
seed(12345)

N = 103
noise = 10
slope = 1.0

def sample(x):
    y = x * slope
    if random() < (y/N)**3:
        y = random()*N      # outlier
    else:
        y += (random()-0.5)*noise # non-outlier, jitter
    return y

samples = [(i*1.0,sample(i)) for i in range(N)]

c = canvas.canvas()

for x,y in samples:
    c.fill(path.circle(x,y,0.5),[color.rgb.red])

def theilsen(samples):
    N = len(samples)
    def slope(i,j):
        xi,yi = samples[i]
        xj,yj = samples[j]
        return (yi-yj)/(xi-xj)

    def median(L):
        L.sort()
        if len(L) & 1:
            return L[len(L)//2]
        else:
            return (L[len(L)//2 - 1] + L[len(L)//2])/2.0

    m = median([slope(i,j) for i in range(N) for j in range(i)])

    def error(i):
        x,y = samples[i]
        return y - m*x

    b = median([error(i) for i in range(N)])

    return m,b

m,b = 1,0
c.stroke(path.line(0,b,N,N*m+b),[color.rgb.green])

m,b = theilsen(samples)
c.stroke(path.line(0,b,N,N*m+b),[color.rgb.black])

def slr(samples):
    N = len(samples)
    sumxy = sum([x*y for x,y in samples])
    sumx = sum([x for x,y in samples])
    sumy = sum([y for x,y in samples])
    sumxx = sum([x*x for x,y in samples])
    m = (sumxy - sumx*sumy/N)/(sumxx - sumx**2/N)
    b = sumy/N - m*sumx/N
    return m,b

m,b = slr(samples)
c.stroke(path.line(0,b,N,N*m+b),[color.rgb.blue])

c.writePDFfile("ThielSen")
檔案歷史
點選日期/時間以檢視該時間的檔案版本。
| 日期/時間 | 縮圖 | 尺寸 | 使用者 | 備註 | |
|---|---|---|---|---|---|
| 目前 | 2011年11月3日 (四) 18:59 | | 2,936 × 3,075(37 KB) | David Eppstein(留言 | 貢獻) | Darker green, thicker lines |
| 2011年7月3日 (日) 23:40 |  | 2,936 × 3,075(37 KB) | David Eppstein(留言 | 貢獻) | {{Information |Description ={{en|1=The en:Theil–Sen estimator (black line) of a set of sample points, compared to the simple linear regression line (blue). The points were generated by adding a small amount of jitter to points on the green dashe |
無法覆蓋此檔案。
檔案用途
下列頁面有用到此檔案:
全域檔案使用狀況
以下其他 wiki 使用了這個檔案:
- ar.wikipedia.org 的使用狀況
- el.wiktionary.org 的使用狀況
- en.wikipedia.org 的使用狀況
- es.wikipedia.org 的使用狀況
- fa.wikipedia.org 的使用狀況
- hy.wikipedia.org 的使用狀況
- ko.wikipedia.org 的使用狀況
- ru.wikipedia.org 的使用狀況
- zh.wikipedia.org 的使用狀況