File:Traffic Control Project milestone Schedule Bar Chart.jpg
Jump to navigation
Jump to search

Size of this preview: 800 × 520 pixels. Other resolutions: 320 × 208 pixels | 640 × 416 pixels | 1,021 × 664 pixels.
Original file (1,021 × 664 pixels, file size: 159 KB, MIME type: image/jpeg)
Captions
Captions
Add a one-line explanation of what this file represents
Summary[edit]
| Description |
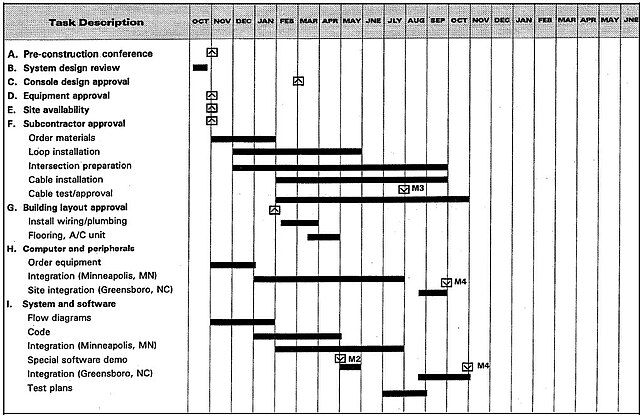
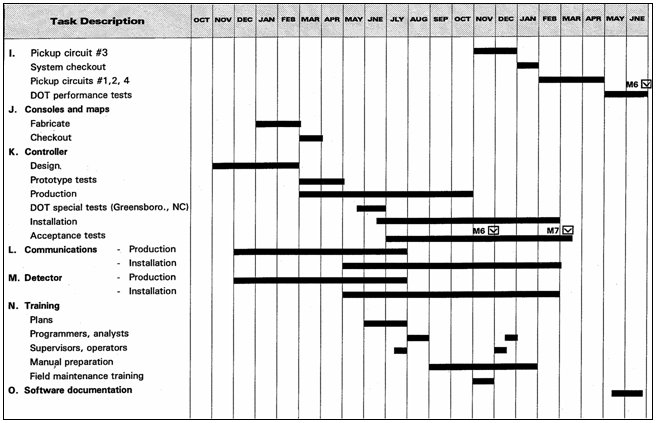
English: Greensboro, NC, Traffic Control Project milestone Schedule;
This figure shows the use of bar charts as a method of project scheduling. This bar chart for the Greensboro, North Carolina, Traffic Control System depicts the time relationship for completion of the various project tasks. Starting and ending dates and durations are shown for the various tasks as well as milestones (the start or completion of a task). The interdependency of tasks may be indicated by a dashed line or other symbol (e.g., M6 indicates the interdependency of acceptance tests for controller assemblies and the installation of communications lines). |
| Date | Last modified: January 23, 2009 |
| Source | image in Traffic Control Systems Handbook: Chapter 12. Design and Implementation |
| Author | United States Department of Transportation - Federal Highway Administration |
| Other versions | File:Traffic Control Project milestone Schedule Bar Chart 2.jpg |
Licensing[edit]
This work is in the public domain in the United States because it is a work prepared by an officer or employee of the United States Government as part of that person’s official duties under the terms of Title 17, Chapter 1, Section 105 of the US Code.
Note: This only applies to original works of the Federal Government and not to the work of any individual U.S. state, territory, commonwealth, county, municipality, or any other subdivision. This template also does not apply to postage stamp designs published by the United States Postal Service since 1978. (See § 313.6(C)(1) of Compendium of U.S. Copyright Office Practices). It also does not apply to certain US coins; see The US Mint Terms of Use.
|
 | |
| This file has been identified as being free of known restrictions under copyright law, including all related and neighboring rights. | ||
File history
Click on a date/time to view the file as it appeared at that time.
| Date/Time | Thumbnail | Dimensions | User | Comment | |
|---|---|---|---|---|---|
| current | 11:05, 23 September 2009 | | 1,021 × 664 (159 KB) | Mdd (talk | contribs) | Image enlarged |
| 09:12, 23 September 2009 |  | 657 × 423 (61 KB) | Mdd (talk | contribs) | {{Information |Description={{en|1=Greensboro, NC, Traffic Control Project milestone Schedule; Figure 12-4 (13) shows the use of bar charts as a method of project scheduling. This bar chart for the Greensboro, North Carolina, Traffic Control System depict |
You cannot overwrite this file.
File usage on Commons
The following page uses this file:
- File:Traffic Control Project milestone Schedule Bar Chart .jpg (file redirect)