File:Tubular neighborhood2.png
Jump to navigation
Jump to search
Size of this preview: 800 × 326 pixels. Other resolutions: 320 × 131 pixels | 640 × 261 pixels | 1,024 × 418 pixels | 2,506 × 1,022 pixels.
Original file (2,506 × 1,022 pixels, file size: 163 KB, MIME type: image/png)
Captions
Captions
Add a one-line explanation of what this file represents
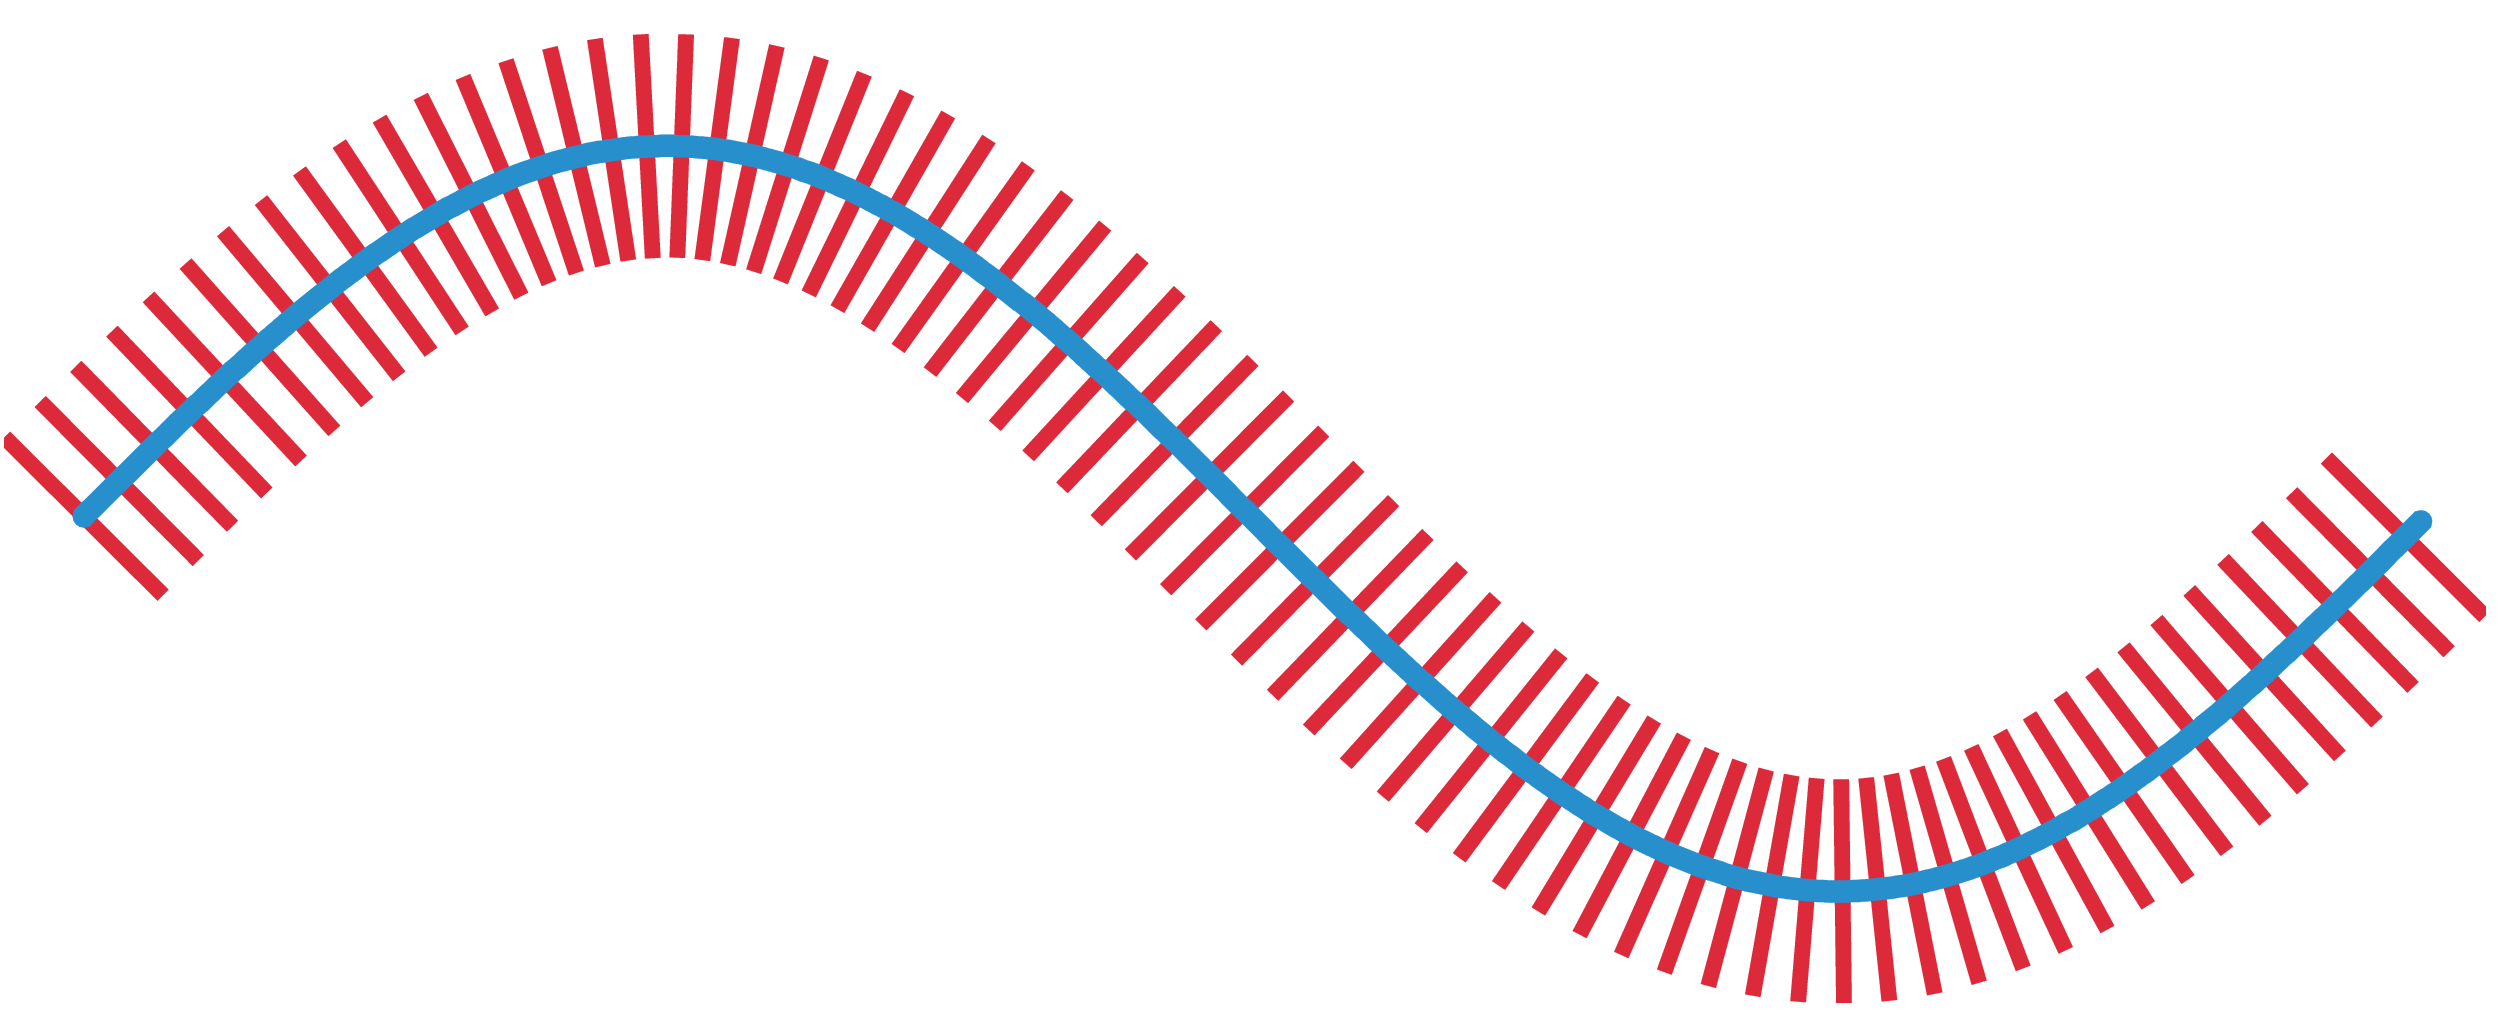
| Description | Illustration of en:Tubular neighborhood | |||
| Source | Made with en:Matlab | |||
| Author | Oleg Alexandrov 03:01, 1 June 2007 (UTC) | |||
| Permission (Reusing this file) |
Public domain | |||
| Other versions |
|


| I, the copyright holder of this work, release this work into the public domain. This applies worldwide. In some countries this may not be legally possible; if so: I grant anyone the right to use this work for any purpose, without any conditions, unless such conditions are required by law. |
Matlab source code
[edit]
% illustration of tubular neighborhood
function main()

   f=inline('sin(x)', 'x'); % will construct a tubular neighborhood of this curve

   a=0; b=2*pi; N = 1000; X = linspace(a, b, N); % consider N points in the interval [a, b]
   Y = f(X); % the curve
   ll = 3; % length of lines perpendicular to the curve
   lls = 0.3; % smaller subsegments

   thin_line = 2;
   thick_line = 4;

%  will draw lines perpendicular to the graph of Y=f(X) at
%  points separted by length of 'spacing'
   spacing = 0.015;
   M = floor(spacing*N);

% colors
   red=[0.867 0.06 0.14];
   blue = [0, 129, 205]/256;
   green = [0, 200,  70]/256;

   figure(1); clf; hold on; axis equal; axis off;


   % plot the lines
   for k=1:N

	  p = (k-1)*M+2;
	  if p >= N
		 break;
	  end

	  % the normal to the curve at (X(p), Y(p))
	  Normal = [-(Y(p+1)-Y(p-1)), X(p+1)-X(p-1)]; Normal = Normal/norm(Normal);

	  plot([X(p)-lls*Normal(1), X(p)+lls*Normal(1)], [Y(p)-lls*Normal(2),...
					Y(p)+lls*Normal(2)], 'color', red, 'linewidth', 0.7*thick_line)

   end

   % plot the curve
   plot(X, Y, 'linewidth', thick_line, 'color', blue);
   saveas(gcf, 'Tubular_neighborhood2.eps', 'psc2')
File history
Click on a date/time to view the file as it appeared at that time.
| Date/Time | Thumbnail | Dimensions | User | Comment | |
|---|---|---|---|---|---|
| current | 04:59, 2 June 2007 | 2,506 × 1,022 (163 KB) | Oleg Alexandrov (talk | contribs) | tweak colors | |
| 03:46, 1 June 2007 | 2,506 × 1,022 (160 KB) | Oleg Alexandrov (talk | contribs) | Tweak. | ||
| 03:23, 1 June 2007 | 626 × 256 (31 KB) | Oleg Alexandrov (talk | contribs) | {{Information |Description=Illustration of en:Tubular neighborhood |Source=Made with en:Matlab |Date= |Author= ~~~~ |Permission=Public domain |other_versions= }} {{PD-self}} |
You cannot overwrite this file.
File usage on Commons
There are no pages that use this file.
File usage on other wikis
The following other wikis use this file:
- Usage on en.wikipedia.org