File:U.S. Temperature Record 1950 to 2009 (Raw Image).png
Jump to navigation
Jump to search
Size of this preview: 763 × 600 pixels. Other resolutions: 306 × 240 pixels | 611 × 480 pixels | 840 × 660 pixels.
Original file (840 × 660 pixels, file size: 229 KB, MIME type: image/png)
Captions
Captions
Add a one-line explanation of what this file represents
Summary
[edit].png&action=edit§ion=1)
| Description |
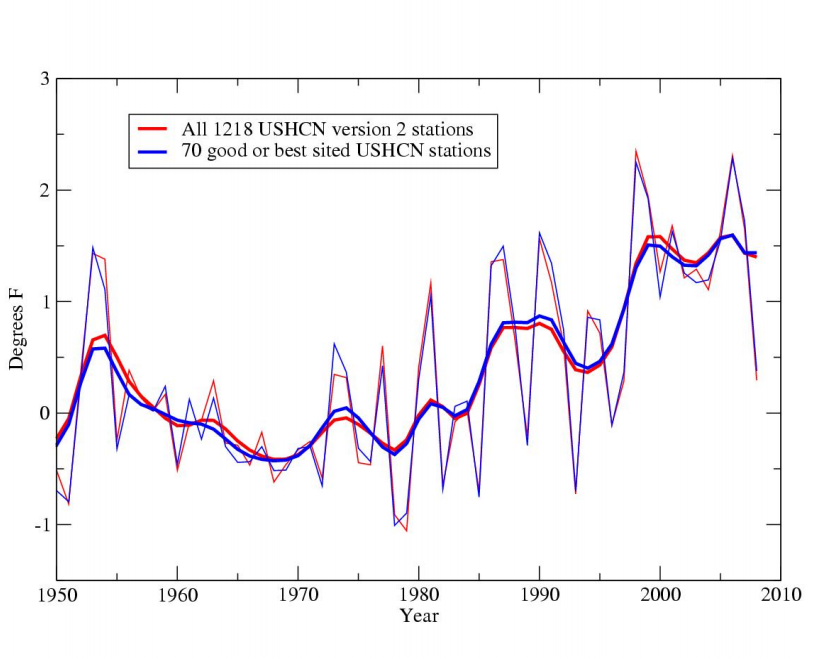
English: This graph shows the increase in temperature in the U.S. according to the 1218 stations in NOAA’s Historical Climatology Network (USHCN), with yearly data going from 1950 to 2009. It incorporates information from the article-- Watts, Anthony, 2009: "Is the U.S. Surface Temperature Record Reliable?" The Heartland Institute, Chicago. 29 pp. |
| Date | |
| Source | This work was created by the National Climatic Data Center (NCDC), a U.S. federal government research agency operating under the National Oceanic and Atmospheric Administration. It is available here. |
| Author | U.S. National Climatic Data Center (NCDC) |
| Other versions | An alternative version exists here. |
_(PNG).png)
Licensing
[edit].png&action=edit§ion=2)
This image is in the public domain because it contains materials that originally came from the U.S. National Oceanic and Atmospheric Administration, taken or made as part of an employee's official duties.
|
File history
Click on a date/time to view the file as it appeared at that time.
| Date/Time | Thumbnail | Dimensions | User | Comment | |
|---|---|---|---|---|---|
| current | 00:36, 14 May 2013 | | 840 × 660 (229 KB) | CoffeeWithMarkets (talk | contribs) | User created page with UploadWizard |
You cannot overwrite this file.
File usage on Commons
There are no pages that use this file.
File usage on other wikis
The following other wikis use this file:
- Usage on en.wikipedia.org
.png&oldid=687545809)