File:US timeline. Number of overdose deaths from all drugs.jpg
跳转到导航
跳转到搜索
本预览的尺寸:799 × 599像素。 其他分辨率:320 × 240像素 | 640 × 480像素 | 1,024 × 768像素 | 1,280 × 960像素 | 1,801 × 1,351像素。
原始文件 (1,801 × 1,351像素,文件大小:155 KB,MIME类型:image/jpeg)
说明
说明
添加一行文字以描述该文件所表现的内容
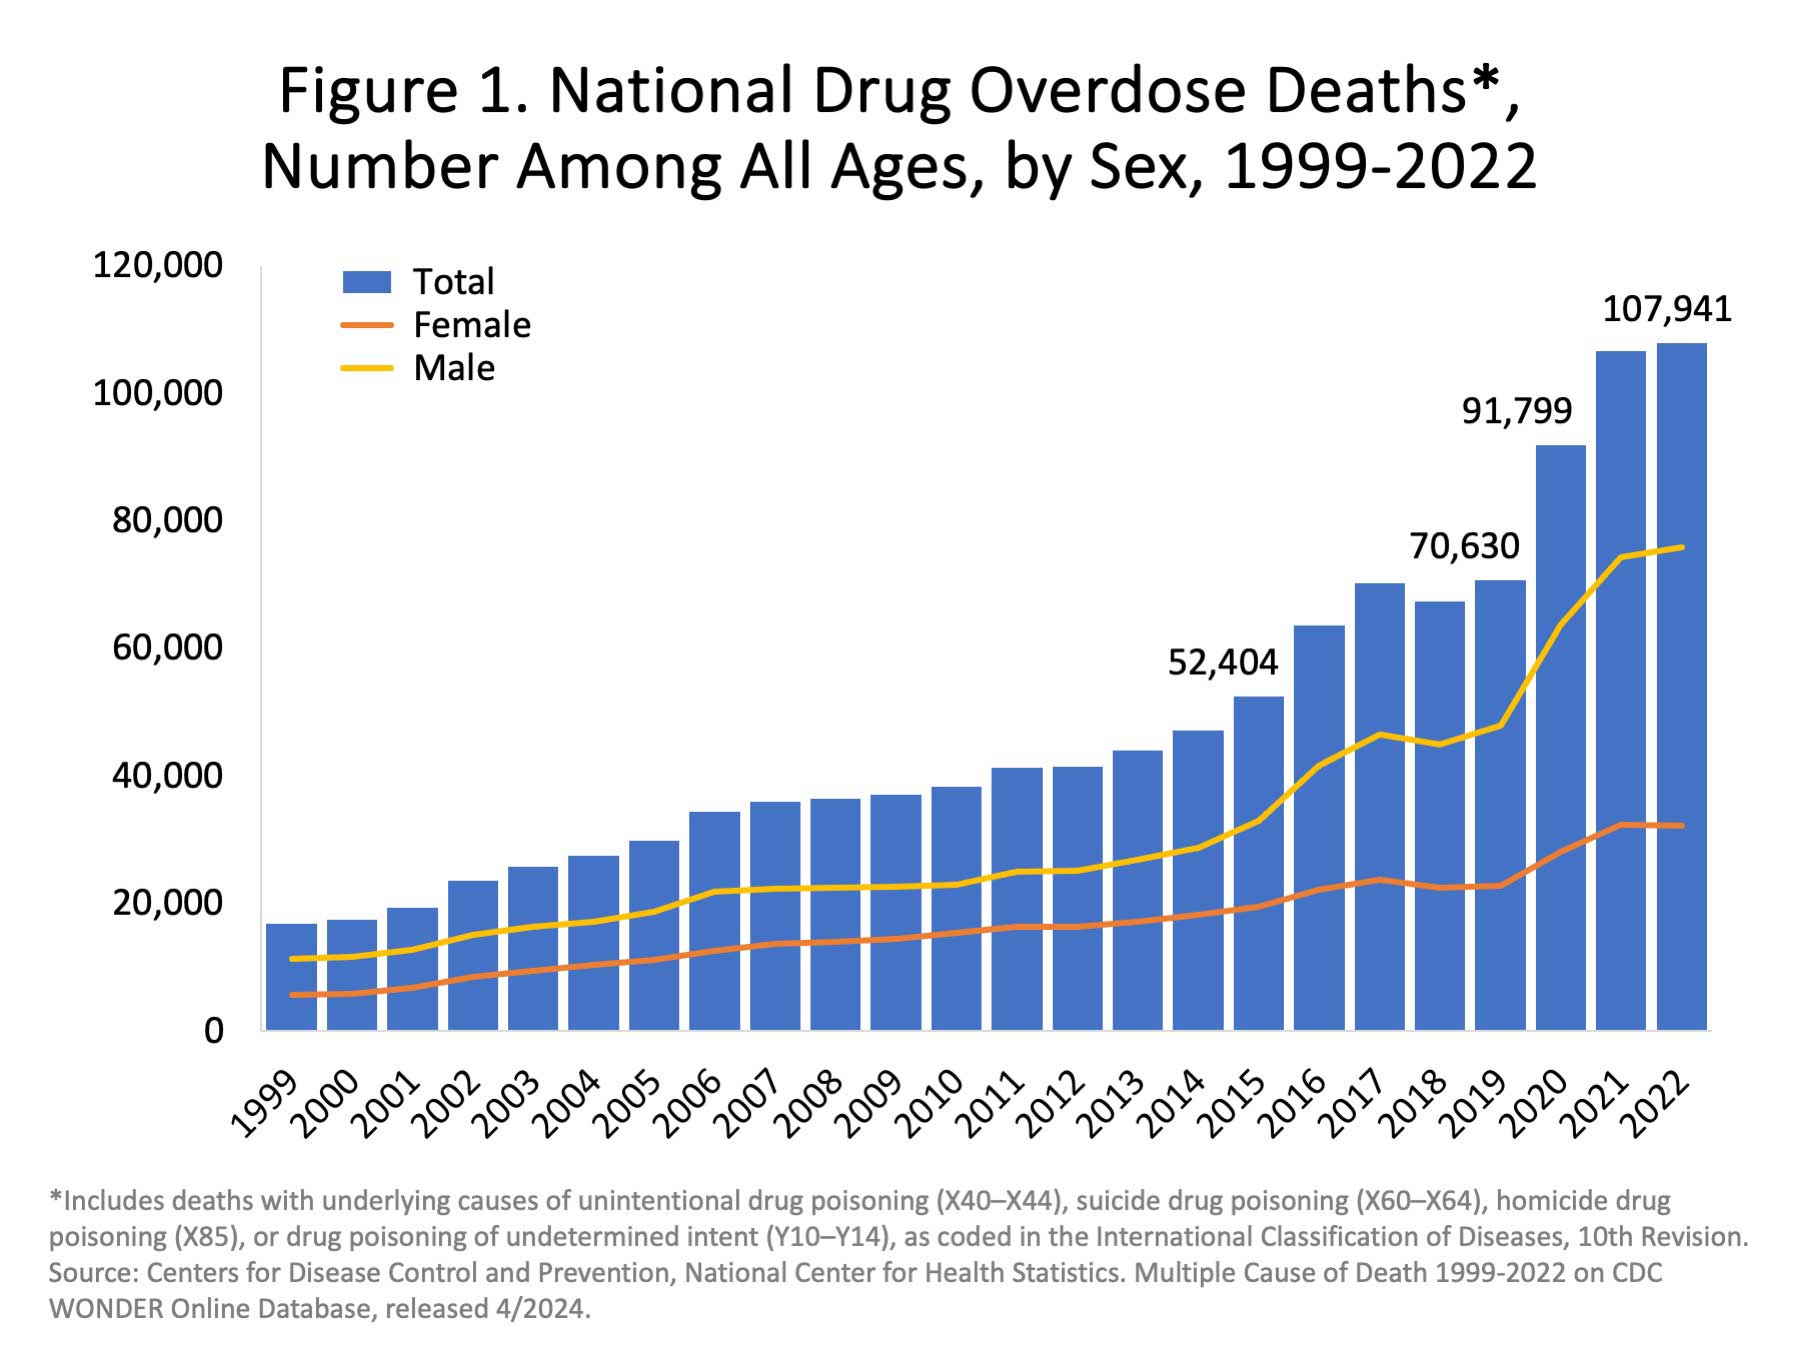
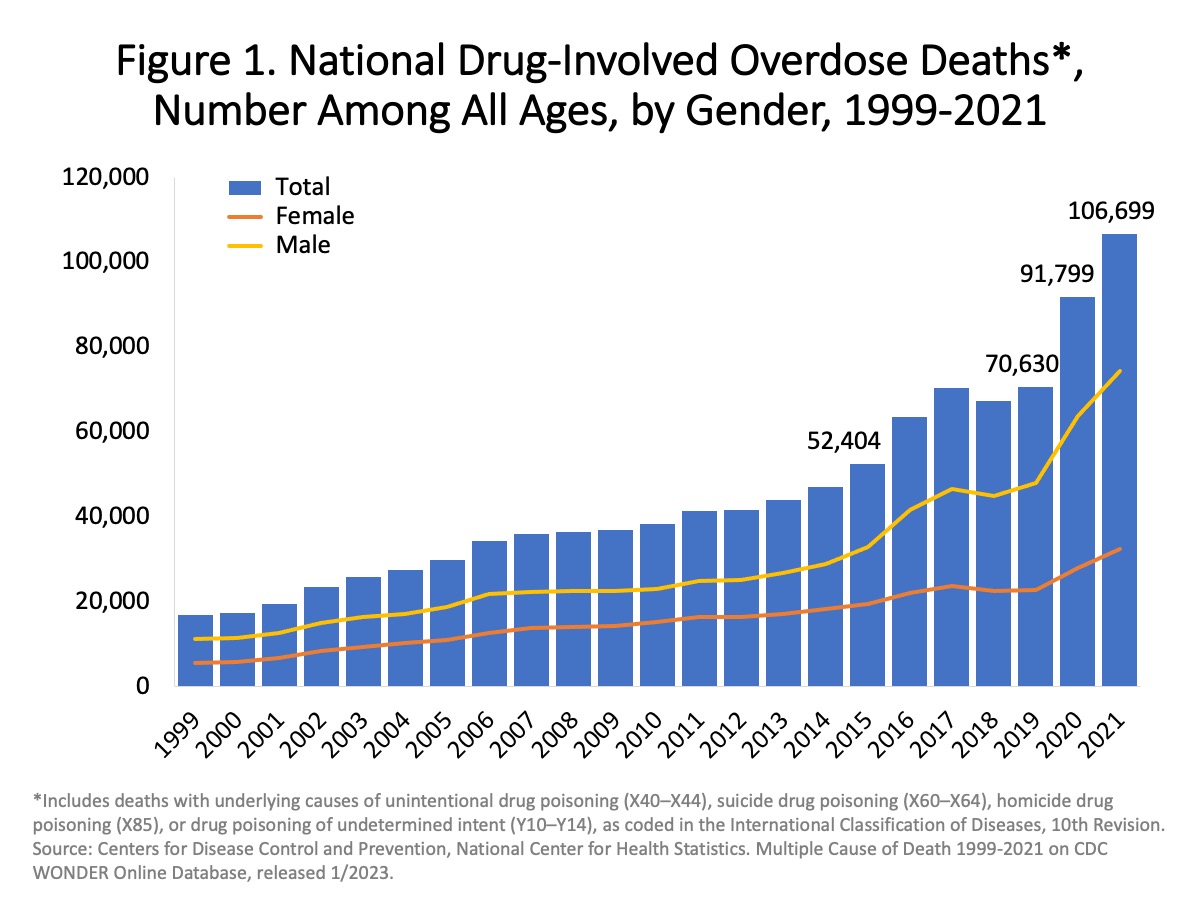
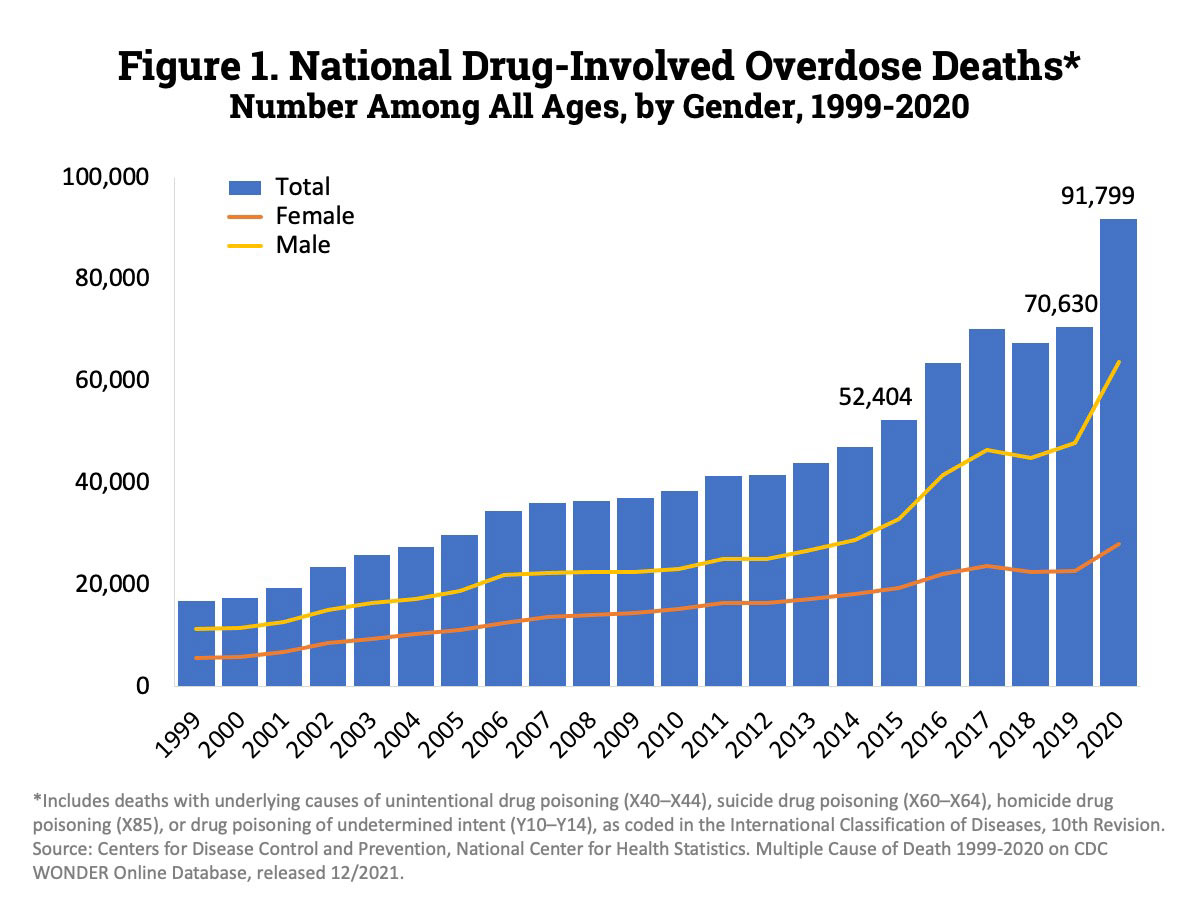
US timeline. Number of overdose deaths from all drugs.

|
File:US timeline. Number of overdose deaths from all drugs.svg是此文件的矢量版本。 如果此文件质量不低于原点阵图,就应该将这个JPG格式文件替换为此文件。
File:US timeline. Number of overdose deaths from all drugs.jpg → File:US timeline. Number of overdose deaths from all drugs.svg
更多信息请参阅Help:SVG/zh。 |
 |
摘要[编辑]
| 描述 |
English: "Figure 1. National Drug Overdose Deaths—Number Among All Ages, by Sex, 1999-2022. Nearly 108,000 persons in the U.S. died from drug-involved overdose in 2022, including from illicit or prescription drugs. The figure is a bar and line graph showing the total number of U.S. drug overdose deaths involving select illicit and prescription drugs from 1999 to 2022. The bars are overlaid by lines showing the number of deaths by gender from 1999 to 2022 (Source: CDC WONDER)." |
| 日期 | - date of first upload here to the Commons. See file history for date of latest upload. |
| 来源 | From Overdose Death Rates. By National Institute on Drug Abuse (NIDA). Click on the chart on the compilation page. The large chart will show up. Right-click it, and then "Open image in new tab" to get image URL. 1999-2022 chart. 1999-2021 chart. 1999-2020 chart. 1999-2019 chart. 2002-2017 chart. 1999-2017 chart. 2002-2015 chart. |
| 作者 | National Institute on Drug Abuse. Some of the charts were cropped to get rid of outer white space. The caption and legend text were edited in some charts. The edited charts were put under the same public domain license. See Commons:Convert tables and charts to wiki code or image files, and the section about removing, adding, and editing text on chart images. |
许可协议[编辑]
This image is a work of the National Institutes of Health, part of the United States Department of Health and Human Services, taken or made as part of an employee's official duties. As a work of the U.S. federal government, the image is in the public domain.
 |
||
| 本文件已被确认为免除已知的著作权法限制(包括所有相关权利)。 | ||
文件历史
点击某个日期/时间查看对应时刻的文件。
| 日期/时间 | 缩略图 | 大小 | 用户 | 备注 | |
|---|---|---|---|---|---|
| 当前 | 2024年5月16日 (四) 13:21 | | 1,801 × 1,351(155 KB) | Timeshifter(留言 | 贡献) | Latest. |
| 2023年7月12日 (三) 16:47 |  | 1,200 × 900(180 KB) | Timeshifter(留言 | 贡献) | Latest | |
| 2022年5月29日 (日) 21:21 |  | 1,200 × 900(153 KB) | Timeshifter(留言 | 贡献) | Latest version | |
| 2021年3月13日 (六) 16:27 |  | 1,106 × 524(130 KB) | Timeshifter(留言 | 贡献) | Latest version. | |
| 2019年8月16日 (五) 17:52 |  | 869 × 675(128 KB) | Timeshifter(留言 | 贡献) | Newer version. | |
| 2018年9月5日 (三) 15:32 |  | 813 × 583(96 KB) | Timeshifter(留言 | 贡献) | new version | |
| 2017年3月27日 (一) 11:42 |  | 840 × 643(103 KB) | Timeshifter(留言 | 贡献) | Added border | |
| 2017年3月21日 (二) 02:17 |  | 837 × 641(96 KB) | Timeshifter(留言 | 贡献) | User created page with UploadWizard |
您不可以覆盖此文件。
文件用途
以下5个页面使用本文件:
全域文件用途
以下其他wiki使用此文件:
- cs.wikipedia.org上的用途
- de.wikipedia.org上的用途
- en.wikipedia.org上的用途
- Substance abuse
- Drug overdose
- 21st century
- Healthcare in the United States
- Political positions of Bernie Sanders
- Presidency of Donald Trump
- Opioid epidemic in the United States
- United States drug overdose death rates and totals over time
- Presidency of Joe Biden
- User:RogerNiceEyes/march2021
- User:Timeshifter/Archive 2
- es.wikipedia.org上的用途
- et.wikipedia.org上的用途
- sr.wikipedia.org上的用途
- www.wikidata.org上的用途
- zh.wikipedia.org上的用途