File:Uranium production world-ar.png
Jump to navigation
Jump to search

Size of this preview: 800 × 351 pixels. Other resolutions: 320 × 140 pixels | 640 × 281 pixels | 1,024 × 449 pixels | 1,280 × 561 pixels | 2,560 × 1,123 pixels | 4,948 × 2,170 pixels.
Original file (4,948 × 2,170 pixels, file size: 911 KB, MIME type: image/png)
Captions
Captions
Add a one-line explanation of what this file represents
Summary[edit]
| Description |
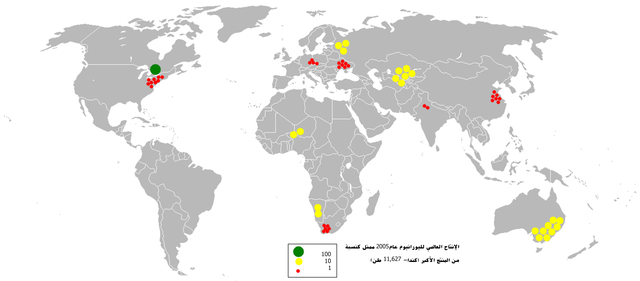
English: This bubble map shows the global distribution of uranium output in 2005 as a percentage of the top producer (Canada - 11,627 tonnes).
This map is consistent with incomplete set of data too as long as the top producer is known. It resolves the accessibility issues faced by colour-coded maps that may not be properly rendered in old computer screens. Data was extracted on 29th May 2007. Source - http://www.bgs.ac.uk/mineralsuk/free_downloads/home.html#WMP Based on en:Image:BlankMap-World.pngالعربية: الإنتاج العالمي لليورانيوم في عام 2012. |
||
| Date | |||
| Source | Derivative from this file | ||
| Author |
Anwar saadat at English Wikipedia
|
||
| Other versions |
|
Licensing[edit]
Anwar saadat at English Wikipedia, the copyright holder of this work, hereby publishes it under the following license:
This file is licensed under the Creative Commons Attribution-Share Alike 3.0 Unported license.
Attribution: Anwar saadat at English Wikipedia
- You are free:
- to share – to copy, distribute and transmit the work
- to remix – to adapt the work
- Under the following conditions:
- attribution – You must give appropriate credit, provide a link to the license, and indicate if changes were made. You may do so in any reasonable manner, but not in any way that suggests the licensor endorses you or your use.
- share alike – If you remix, transform, or build upon the material, you must distribute your contributions under the same or compatible license as the original.
Original upload log[edit]
The original description page was here. All following user names refer to en.wikipedia.
- 2007-05-29 15:21 Anwar saadat 1425×625× (60286 bytes) This bubble map shows the global distribution of uranium output in 2005 as a percentage of the top producer (Canada - 11,627 tonnes). This map is consistent with incomplete set of data too as long as the top producer is known. It resolves the accessibili
File history
Click on a date/time to view the file as it appeared at that time.
| Date/Time | Thumbnail | Dimensions | User | Comment | |
|---|---|---|---|---|---|
| current | 20:12, 1 July 2019 | | 4,948 × 2,170 (911 KB) | نادين (talk | contribs) | User created page with UploadWizard |
You cannot overwrite this file.
File usage on Commons
There are no pages that use this file.
File usage on other wikis
The following other wikis use this file:
- Usage on ar.wikipedia.org