File:Variación de la población española entre 1981 y 2005.svg
Jump to navigation
Jump to search

Size of this PNG preview of this SVG file: 568 × 387 pixels. Other resolutions: 320 × 218 pixels | 640 × 436 pixels | 1,024 × 698 pixels | 1,280 × 872 pixels | 2,560 × 1,744 pixels.
Original file (SVG file, nominally 568 × 387 pixels, file size: 1.5 MB)
Captions
Captions
Add a one-line explanation of what this file represents
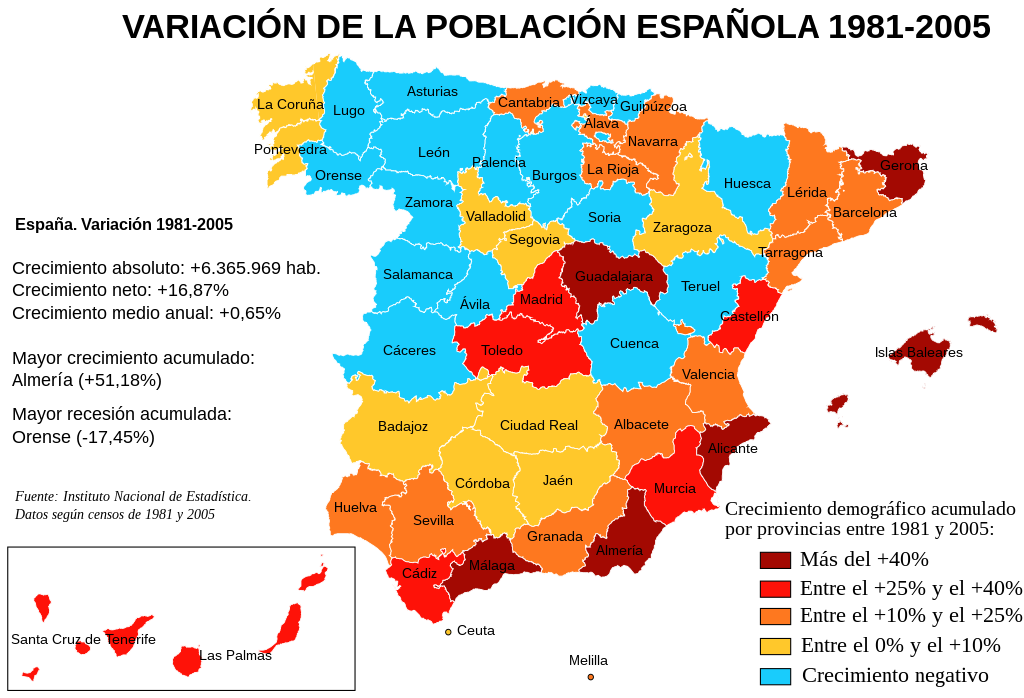
| Description | Mapa de España con las variaciones de población por provincias en el periodo 1981-2005, según los censos correspondientes del Instituto Nacional de Estadística. |
| Date | |
| Source | Instituto Nacional de Estadística de España [1] |
| Author | Creado por Rodriguillo, tomando como mapa base Image:Provinces of Spain.svg, creado por Emilio Gómez Fernández |
| Permission (Reusing this file) |
GFDL |
| Other versions |
Image:Variación de la población española entre 1981 y 2005.png Image:Spanish population evolution between 1981 and 2005-fr.png |
| This work has been released into the public domain by its author, Rodriguillo. This applies worldwide. In some countries this may not be legally possible; if so: |
File history
Click on a date/time to view the file as it appeared at that time.
| Date/Time | Thumbnail | Dimensions | User | Comment | |
|---|---|---|---|---|---|
| current | 00:46, 30 August 2007 | | 568 × 387 (1.5 MB) | Rodriguillo (talk | contribs) | |
| 01:42, 8 August 2007 |  | 568 × 387 (1.5 MB) | Rodriguillo (talk | contribs) | {{Information |Description= Mapa de España con las '''variaciones de población''' por provincias en el periodo 1981-2005, según los censos correspondientes del Instituto Nacional de Estadística. |Source= Instituto Nacional de Estadística de Esp |
You cannot overwrite this file.
File usage on Commons
The following page uses this file:
File usage on other wikis
The following other wikis use this file:
- Usage on cy.wikipedia.org
- Usage on es.wikipedia.org
- Usage on ext.wikipedia.org
- Usage on fr.wikipedia.org
- Usage on gl.wikipedia.org
- Usage on pl.wikipedia.org