File:Volcano eg.jpg
Jump to navigation
Jump to search

Size of this preview: 800 × 600 pixels. Other resolutions: 320 × 240 pixels | 640 × 480 pixels | 1,024 × 768 pixels | 1,280 × 960 pixels | 1,728 × 1,296 pixels.
Original file (1,728 × 1,296 pixels, file size: 201 KB, MIME type: image/jpeg)
Captions
Captions
Add a one-line explanation of what this file represents
Summary
[edit]
| Description |
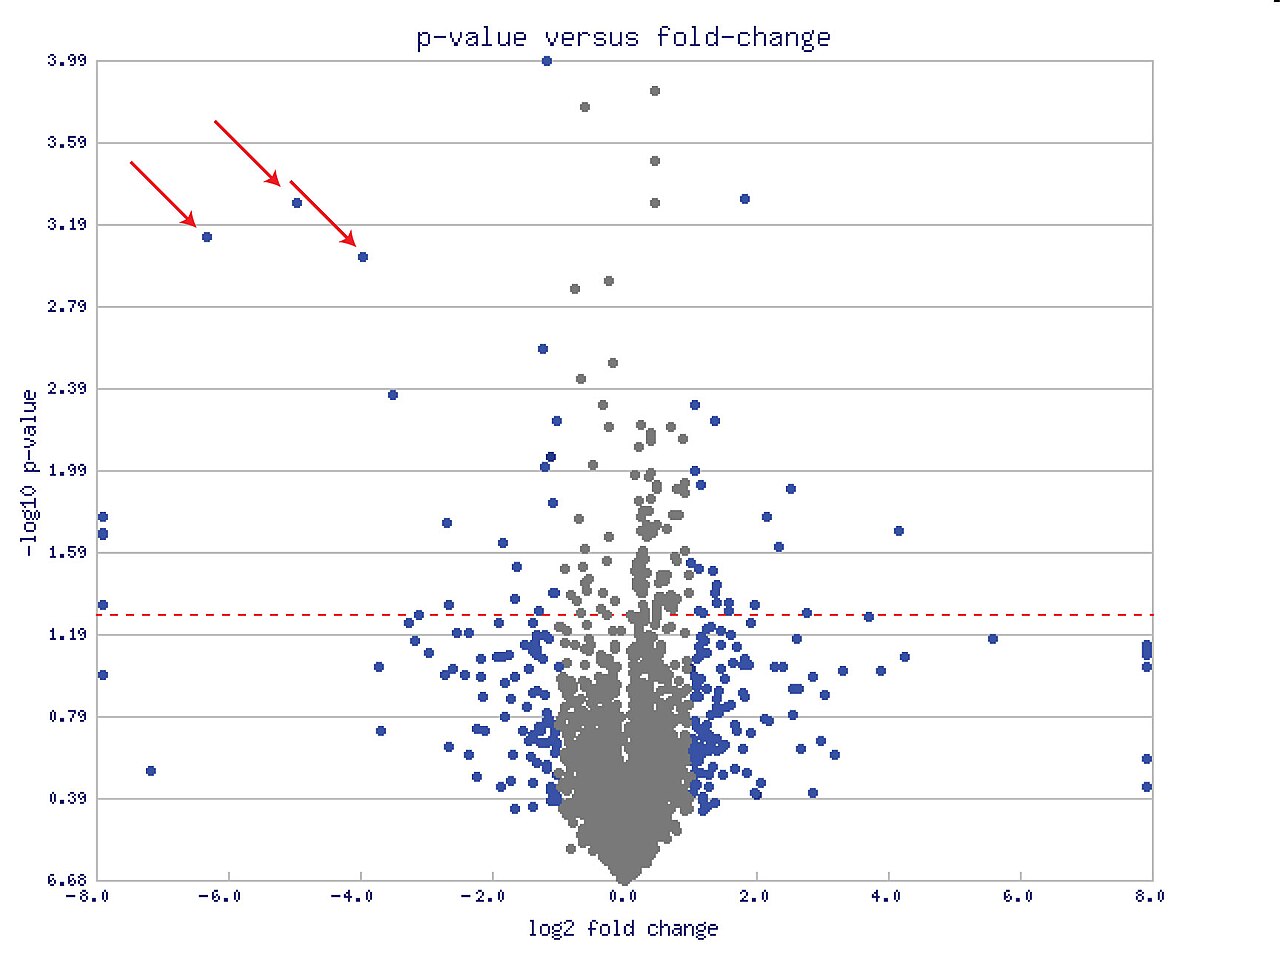
English: Example of a Volcano plot (statistics), here showing metabolomic data. The three red arrows indicate points that display both large-magnitude fold-changes (x-axis) as well as high statistical significance (-log10 of p-value, y-axis). The dashed red-line shows where p = 0.05 with points above the line having p < 0.05 and points below the line having p > 0.05. This plot is colored such that those points having a fold-change less than 2 (log2 = 1) are shown in gray. |
| Date | |
| Source | Own work |
| Author | Roadnottaken |
Licensing
[edit]
| I, the copyright holder of this work, release this work into the public domain. This applies worldwide. In some countries this may not be legally possible; if so: I grant anyone the right to use this work for any purpose, without any conditions, unless such conditions are required by law. |
File history
Click on a date/time to view the file as it appeared at that time.
| Date/Time | Thumbnail | Dimensions | User | Comment | |
|---|---|---|---|---|---|
| current | 20:39, 3 January 2010 | | 1,728 × 1,296 (201 KB) | Roadnottaken (talk | contribs) | {{Information |Description={{en|1=Example of a volano plot (statistics), here showing metabolomic data. The three red arrows indicate points that display both large-magnitude fold-changes (x-axis) as well as high statistical significance (-log10 |
You cannot overwrite this file.
File usage on Commons
There are no pages that use this file.
File usage on other wikis
The following other wikis use this file:
- Usage on en.wikipedia.org
- Usage on uz.wikipedia.org