File:WMAP 2008 61GHz foregrounds.png
跳至導覽
跳至搜尋

預覽大小:800 × 400 像素。 其他解析度:320 × 160 像素 | 640 × 320 像素 | 1,024 × 512 像素 | 1,280 × 640 像素 | 2,048 × 1,024 像素。
原始檔案 (2,048 × 1,024 像素,檔案大小:1.7 MB,MIME 類型:image/png)
說明
說明
添加單行說明來描述出檔案所代表的內容
摘要
[編輯]
| 描述 |
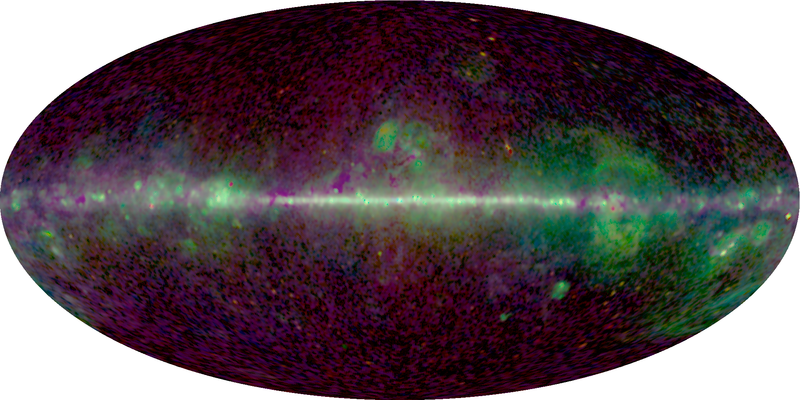
English: "Three-color maps from the Maximum Entropy Method (MEM) model for the 5 WMAP frequency bands. These maps indicate which emission mechanism dominates as a function of frequency and sky position. Synchrotron is red, free-free is green, and thermal dust is blue." V-Band Map (61 GHz), logarithmic scale. |
| 日期 | |
| 來源 | LAMBDA WMAP Images; [1] |
| 作者 | NASA / WMAP Science Team |
![[1]](http://lambda.gsfc.nasa.gov/product/map/current/map_images/mem_3color_5yr_V_2048.png)
授權條款
[編輯]
| 本作品由NASA創作,屬於公有領域。根據NASA的版權政策:“NASA的創作除非另有聲明否則不受版權保護。”(參見:Template:PD-USGov/zh,NASA版權政策或JPL圖像使用政策) | ||
 |
警告:
|
檔案歷史
點選日期/時間以檢視該時間的檔案版本。
| 日期/時間 | 縮圖 | 尺寸 | 使用者 | 備註 | |
|---|---|---|---|---|---|
| 目前 | 2008年4月26日 (六) 14:51 | | 2,048 × 1,024(1.7 MB) | Mike Peel(留言 | 貢獻) | == Summary == {{Information |Description={{en|"Three-color maps from the Maximum Entropy Method (MEM) model for the 5 WMAP frequency bands. These maps indicate which emission mechanism dominates as a function of frequency and sky position. Synchrotron is |
無法覆蓋此檔案。
檔案用途
沒有使用此檔案的頁面。
全域檔案使用狀況
以下其他 wiki 使用了這個檔案:
- en.wikipedia.org 的使用狀況
- it.wikipedia.org 的使用狀況
- uk.wikipedia.org 的使用狀況
- zh.wikipedia.org 的使用狀況