File:WMAP 2008 94GHz foregrounds.png
跳转到导航
跳转到搜索

本预览的尺寸:800 × 400像素。 其他分辨率:320 × 160像素 | 640 × 320像素 | 1,024 × 512像素 | 1,280 × 640像素 | 2,048 × 1,024像素。
原始文件 (2,048 × 1,024像素,文件大小:1.58 MB,MIME类型:image/png)
说明
说明
添加一行文字以描述该文件所表现的内容
摘要
[编辑]
| 描述 |
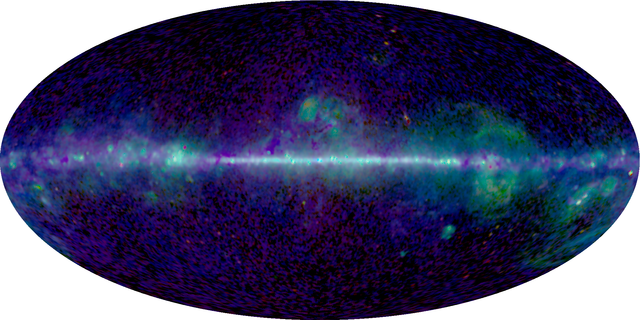
English: "Three-color maps from the Maximum Entropy Method (MEM) model for the 5 WMAP frequency bands. These maps indicate which emission mechanism dominates as a function of frequency and sky position. Synchrotron is red, free-free is green, and thermal dust is blue." W-Band Map (94 GHz), logarithmic scale. |
| 日期 | |
| 来源 | LAMBDA WMAP Images; [1] |
| 作者 | NASA / WMAP Science Team |
![[1]](http://lambda.gsfc.nasa.gov/product/map/current/map_images/mem_3color_5yr_W_2048.png)
许可协议
[编辑]
| 本文件完全由NASA创作,在美国属于公有领域。根据NASA的版权方针,NASA的材料除非另有声明否则不受版权保护。(参见Template:PD-USGov/zh、NASA版权方针页面或JPL图片使用方针。) | ||
 |
警告:
|
文件历史
点击某个日期/时间查看对应时刻的文件。
| 日期/时间 | 缩略图 | 大小 | 用户 | 备注 | |
|---|---|---|---|---|---|
| 当前 | 2008年4月26日 (六) 14:56 | | 2,048 × 1,024(1.58 MB) | Mike Peel(留言 | 贡献) | == Summary == {{Information |Description={{en|"Three-color maps from the Maximum Entropy Method (MEM) model for the 5 WMAP frequency bands. These maps indicate which emission mechanism dominates as a function of frequency and sky position. Synchrotron is |
您不可以覆盖此文件。
文件用途
没有页面使用本文件。
全域文件用途
以下其他wiki使用此文件:
- en.wikipedia.org上的用途
- it.wikipedia.org上的用途
- uk.wikipedia.org上的用途
- zh.wikipedia.org上的用途