File:WarszawaPowodz2010.png

Original file (1,280 × 696 pixels, file size: 30 KB, MIME type: image/png)
Captions
Captions
Summary[edit]
| Description |
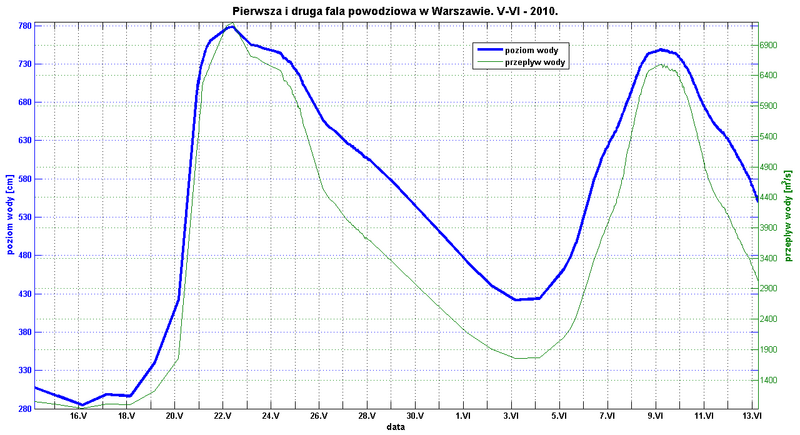
English: State of water in the Vistula River in Warsaw, during the floods of 2010.
Polski: Stan wody w Wiśle w Warszawie podczas powodzi 2010.
Kod w matlabie rysujący wykres: data=[ % 2010-06-13 480+08.00 550 3020 % 2010-06-13 480+07.50 553 3050 % 2010-06-13 480+07.00 554 3060 % 2010-06-13 480+06.50 558 3110 % 2010-06-13 480+06.00 559 3120 % 2010-06-13 480+05.50 561 3140 % 2010-06-13 480+05.00 563 3170 % 2010-06-13 480+04.50 563 3170 % 2010-06-13 480+04.00 566 3200 % 2010-06-13 480+03.50 567 3210 % 2010-06-13 480+03.00 570 3250 % 2010-06-13 480+02.50 571 3260 % 2010-06-13 480+02.00 572 3270 % 2010-06-13 480+01.50 573 3290 % 2010-06-13 480+01.00 576 3320 % 2010-06-13 480+00.50 578 3350 % 2010-06-13 480+00.00 580 3370 % 2010-06-12 456+23.50 581 3380 % 2010-06-12 456+23.00 583 3410 % 2010-06-12 456+22.50 584 3420 % 2010-06-12 456+22.00 584 3420 % 2010-06-12 456+21.50 585 3430 % 2010-06-12 456+21.00 588 3470 % 2010-06-12 456+20.50 588 3470 % 2010-06-12 456+20.00 589 3480 % 2010-06-12 456+19.50 591 3500 % 2010-06-12 456+19.00 591 3500 % 2010-06-12 456+18.00 594 3540 % 2010-06-12 456+17.00 597 3580 % 2010-06-12 456+16.00 600 3620 % 2010-06-12 456+15.50 600 3620 % 2010-06-12 456+15.00 603 3660 % 2010-06-12 456+14.50 604 3680 % 2010-06-12 456+14.00 605 3690 % 2010-06-12 456+13.50 605 3690 % 2010-06-12 456+13.00 607 3720 % 2010-06-12 456+12.50 608 3730 % 2010-06-12 456+12.00 608 3730 % 2010-06-12 456+11.50 609 3750 % 2010-06-12 456+11.00 612 3790 % 2010-06-12 456+10.50 613 3810 % 2010-06-12 456+10.00 614 3820 % 2010-06-12 456+09.50 615 3840 % 2010-06-12 456+09.00 617 3870 % 2010-06-12 456+08.50 617 3870 % 2010-06-12 456+08.00 619 3900 % 2010-06-12 456+07.50 619 3900 % 2010-06-12 456+07.00 621 3930 % 2010-06-12 456+06.50 622 3940 % 2010-06-12 456+06.00 622 3940 % 2010-06-12 456+05.50 624 3970 % 2010-06-12 456+05.00 626 4010 % 2010-06-12 456+04.50 627 4020 % 2010-06-12 456+04.00 627 4020 % 2010-06-12 456+03.50 629 4050 % 2010-06-12 456+03.00 630 4070 % 2010-06-12 456+02.50 632 4100 % 2010-06-12 456+02.00 632 4100 % 2010-06-12 456+01.50 633 4120 % 2010-06-12 456+01.00 634 4140 % 2010-06-12 456+00.50 634 4140 % 2010-06-12 456+00.00 635 4160 % 2010-06-11 432+23.50 637 4190 % 2010-06-11 432+23.00 638 4210 % 2010-06-11 432+22.50 638 4210 % 2010-06-11 432+22.00 640 4240 % 2010-06-11 432+21.50 640 4240 % 2010-06-11 432+21.00 640 4240 % 2010-06-11 432+20.00 641 4260 % 2010-06-11 432+18.00 644 4310 % 2010-06-11 432+17.00 645 4330 % 2010-06-11 432+15.00 648 4380 % 2010-06-11 432+14.00 650 4420 % 2010-06-11 432+13.00 651 4440 % 2010-06-11 432+12.00 653 4480 % 2010-06-11 432+11.00 655 4520 % 2010-06-11 432+10.00 657 4550 % 2010-06-11 432+09.00 660 4610 % 2010-06-11 432+06.00 666 4730 % 2010-06-11 432+05.50 667 4750 % 2010-06-11 432+05.00 669 4790 % 2010-06-11 432+04.50 670 4810 % 2010-06-11 432+04.00 671 4840 % 2010-06-11 432+03.50 671 4840 % 2010-06-11 432+03.00 673 4900 % 2010-06-11 432+02.50 675 4960 % 2010-06-11 432+02.00 675 4960 % 2010-06-11 432+01.50 677 5010 % 2010-06-11 432+01.00 679 5070 % 2010-06-11 432+00.50 680 5100 % 2010-06-11 432+00.00 681 5120 % 2010-06-10 408+23.50 683 5160 % 2010-06-10 408+23.00 684 5180 % 2010-06-10 408+22.50 686 5230 % 2010-06-10 408+22.00 688 5270 % 2010-06-10 408+21.50 689 5290 % 2010-06-10 408+21.00 689 5290 % 2010-06-10 408+20.50 692 5350 % 2010-06-10 408+20.00 693 5370 % 2010-06-10 408+19.50 695 5420 % 2010-06-10 408+19.00 697 5460 % 2010-06-10 408+18.50 698 5480 % 2010-06-10 408+18.00 700 5520 % 2010-06-10 408+17.00 703 5580 % 2010-06-10 408+16.00 705 5630 % 2010-06-10 408+15.00 709 5710 % 2010-06-10 408+14.00 712 5770 % 2010-06-10 408+13.00 715 5840 % 2010-06-10 408+12.00 718 5900 % 2010-06-10 408+11.00 720 5940 % 2010-06-10 408+10.00 723 6010 % 2010-06-10 408+09.00 725 6050 % 2010-06-10 408+08.00 727 6090 % 2010-06-10 408+07.00 728 6120 % 2010-06-10 408+06.00 732 6200 % 2010-06-10 408+05.50 733 6230 % 2010-06-10 408+05.00 732 6200 % 2010-06-10 408+04.50 733 6230 % 2010-06-10 408+04.00 735 6270 % 2010-06-10 408+03.50 736 6290 % 2010-06-10 408+03.00 736 6290 % 2010-06-10 408+02.50 737 6310 % 2010-06-10 408+02.00 739 6360 % 2010-06-10 408+01.50 740 6380 % 2010-06-10 408+01.00 740 6380 % 2010-06-10 408+00.50 740 6380 % 2010-06-10 408+00.00 741 6400 % 2010-06-09 384+23.50 742 6420 % 2010-06-09 384+23.00 743 6450 % 2010-06-09 384+22.50 743 6450 % 2010-06-09 384+22.00 743 6450 % 2010-06-09 384+21.50 745 6490 % 2010-06-09 384+21.00 744 6470 % 2010-06-09 384+20.50 745 6490 % 2010-06-09 384+20.00 744 6470 % 2010-06-09 384+19.50 744 6470 % 2010-06-09 384+19.00 744 6470 % 2010-06-09 384+18.50 746 6510 % 2010-06-09 384+18.00 746 6510 % 2010-06-09 384+17.00 745 6490 % 2010-06-09 384+16.00 745 6490 % 2010-06-09 384+15.00 746 6510 % 2010-06-09 384+14.00 747 6530 % 2010-06-09 384+13.00 748 6560 % 2010-06-09 384+12.00 747 6530 % 2010-06-09 384+11.00 748 6560 % 2010-06-09 384+10.00 749 6580 % 2010-06-09 384+09.00 747 6530 % 2010-06-09 384+08.00 749 6580 % 2010-06-09 384+07.00 749 6580 % 2010-06-09 384+06.00 749 6580 % 2010-06-08 360+19.5 745 6490 % 2010-06-08 360+19 744 6470 % 2010-06-08 360+18.5 744 6470 % 2010-06-08 360+18 743 6450 % 2010-06-08 360+17.5 742 6420 % 2010-06-08 360+17 742 6420 % 2010-06-08 360+16.5 740 6380 % 2010-06-08 360+16 740 6380 % 2010-06-08 360+15.5 739 6360 % 2010-06-08 360+15 737 6310 % 2010-06-08 360+14.5 736 6290 % 2010-06-08 360+14 736 6290 % 2010-06-08 360+13.5 734 6250 % 2010-06-08 360+12.5 732 6200 % 2010-06-08 360+12 731 6180 % 2010-06-08 360+11.5 730 6160 % 2010-06-08 360+11 727 6090 % 2010-06-08 360+10.5 727 6090 % 2010-06-08 360+10 726 6070 % 2010-06-08 360+09.5 724 6030 % 2010-06-08 360+09 722 5980 % 2010-06-08 360+08.5 721 5960 % 2010-06-08 360+08 718 5900 % 2010-06-08 360+07.5 716 5860 % 2010-06-08 360+07 715 5840 % 2010-06-08 360+06 712 5770 % 2010-06-08 360+05 708 5690 % 2010-06-08 360+04 704 5600 % 2010-06-08 360+03 701 5540 % 2010-06-08 360+02 697 5460 % 2010-06-08 360+01 693 5370 % 2010-06-08 360+00 690 5310 % 2010-06-07 336+23 686 5230 % 2010-06-07 336+22 684 5180 % 2010-06-07 336+21 680 5100 % 2010-06-07 336+20 677 5010 % 2010-06-07 336+19 673 4900 % 2010-06-07 336+18.5 671 4840 % 2010-06-07 336+18 669 4790 % 2010-06-07 336+17.5 668 4770 % 2010-06-07 336+17 665 4710 % 2010-06-07 336+16.5 665 4710 % 2010-06-07 336+16 663 4670 % 2010-06-07 336+15.5 661 4630 % 2010-06-07 336+15 660 4610 % 2010-06-07 336+14.5 658 4570 % 2010-06-07 336+14 656 4530 % 2010-06-07 336+13.5 654 4500 % 2010-06-07 336+13 654 4500 % 2010-06-07 336+12.5 651 4440 % 2010-06-07 336+12 649 4400 % 2010-06-07 336+11.5 648 4380 % 2010-06-07 336+11 647 4370 % 2010-06-07 336+10.5 645 4330 % 2010-06-07 336+10 643 4290 % 2010-06-07 336+09.5 642 4280 % 2010-06-07 336+09 641 4260 % 2010-06-07 336+08.5 641 4260 % 2010-06-07 336+08 639 4220 % 2010-06-07 336+07.5 638 4210 % 2010-06-07 336+07 636 4170 % 2010-06-07 336+06 634 4140 % 2010-06-07 336+05 632 4100 % 2010-06-07 336+04 630 4070 % 2010-06-07 336+03 627 4020 % 2010-06-07 336+02 623 3960 % 2010-06-07 336+01 621 3930 % 2010-06-07 336+00 619 3900 % 2010-06-06 312+23 616 3850 % 2010-06-06 312+22 613 3810 % 2010-06-06 312+21 611 3780 % 2010-06-06 312+20 608 3730 % 2010-06-06 312+19 605 3690 % 2010-06-06 312+18 600 3620 % 2010-06-06 312+12 578 3350 % 2010-06-06 312+06 551 3030 % 2010-06-05 288+18 496 2430 % 2010-06-05 288+12 477 2230 % 2010-06-05 288+06 462 2090 % 2010-06-04 264+06 424 1770 % 2010-06-03 240+06 422 1760 % 2010-06-02 216+06 441 1910 % 2010-06-01 192+06 472 2180 % 2010-05-31 168+06 506 2540 % 2010-05-30 144+06 540 2910 % 2010-05-29 120+06 573 3290 % 2010-05-28 96+06.50 603 3660 % 2010-05-28 96+06.00 604 3680 % 2010-05-28 96+05.50 604 3680 % 2010-05-28 96+05.00 604 3680 % 2010-05-28 96+04.50 605 3690 % 2010-05-28 96+04.00 605 3690 % 2010-05-28 96+03.50 605 3690 % 2010-05-28 96+03.00 606 3700 % 2010-05-28 96+02.50 607 3720 % 2010-05-28 96+02.00 607 3720 % 2010-05-28 96+01.50 609 3750 % 2010-05-28 96+01.00 608 3730 % 2010-05-28 96+00.50 607 3720 % 2010-05-28 96+00.00 609 3750 % 2010-05-27 72+23.50 608 3730 % 2010-05-27 72+23.00 610 3760 % 2010-05-27 72+22.50 611 3780 % 2010-05-27 72+22.00 612 3790 % 2010-05-27 72+21.50 612 3790 % 2010-05-27 72+21.00 613 3810 % 2010-05-27 72+20.50 613 3810 % 2010-05-27 72+20.00 614 3820 % 2010-05-27 72+19.50 614 3820 % 2010-05-27 72+19.00 614 3820 % 2010-05-27 72+18.50 615 3840 % 2010-05-27 72+18.00 616 3850 % 2010-05-27 72+17.00 617 3870 % 2010-05-27 72+16.00 617 3870 % 2010-05-27 72+15.00 618 3880 % 2010-05-27 72+14.00 620 3910 % 2010-05-27 72+13.00 620 3910 % 2010-05-27 72+12.00 622 3940 % 2010-05-27 72+11.00 622 3940 % 2010-05-27 72+10.00 624 3970 % 2010-05-27 72+09.00 625 3990 % 2010-05-27 72+08.00 625 3990 % 2010-05-27 72+07.00 626 4010 % 2010-05-27 72+06.00 627 4020 % 2010-05-26 48+18.00 643 4290 % 2010-05-26 48+12.00 648 4380 % 2010-05-26 48+06.00 657 4550 % 2010-05-25 24+11.50 701 5540 % 2010-05-25 24+11.00 702 5560 % 2010-05-25 24+10.50 703 5580 % 2010-05-25 24+10.00 705 5630 % 2010-05-25 24+09.50 707 5670 % 2010-05-25 24+09.00 708 5690 % 2010-05-25 24+08.50 710 5730 % 2010-05-25 24+08.00 712 5770 % 2010-05-25 24+07.50 715 5840 % 2010-05-25 24+07.00 716 5860 % 2010-05-25 24+06.50 716 5860 % 2010-05-25 24+06.00 716 5860 % 2010-05-25 24+05.50 718 5900 % 2010-05-25 24+05.00 717 5880 % 2010-05-25 24+04.50 719 5920 % 2010-05-25 24+04.00 720 5940 % 2010-05-25 24+03.50 722 5980 % 2010-05-25 24+03.00 722 5980 % 2010-05-25 24+02.50 723 6010 % 2010-05-25 24+02.00 724 6030 % 2010-05-25 24+01.50 724 6030 % 2010-05-25 24+01.00 725 6050 % 2010-05-25 24+00.50 727 6090 % 2010-05-25 24+00.00 727 6090 % 2010-05-24 23.50 728 6120 % 2010-05-24 23.00 730 6160 % 2010-05-24 22.00 732 6200 % 2010-05-24 21.00 733 6230 % 2010-05-24 20.00 733 6230 % 2010-05-24 19.00 734 6250 % 2010-05-24 18.00 736 6290 % 2010-05-24 17.00 737 6310 % 2010-05-24 16.00 737 6310 % 2010-05-24 15.00 737 6310 % 2010-05-24 14.00 740 6380 % 2010-05-24 13.00 742 6420 % 2010-05-24 12.00 744 6470 % 2010-05-24 06.00 747 6530 % 2010-05-23 -24+18.00 751 6620 % 2010-05-23 -24+12.00 754 6690 % 2010-05-23 -24+06.00 755 6710 % 2010-05-22 -48+18.00 771 7070 % 2010-05-22 -48+12.00 779 7260 % 2010-05-22 -48+06.00 777 7210 % 2010-05-21 -72+13.00 760 6564%cm % 2010-05-21 -72+12.50 758 6544%cm % 2010-05-21 -72+12.00 758 6524%cm % 2010-05-21 -72+11.50 756 6505%cm % 2010-05-21 -72+11.00 756 6485%cm % 2010-05-21 -72+10.50 753 6466%cm % 2010-05-21 -72+10.00 753 6446%cm % 2010-05-21 -72+9.50 751 6427%cm % 2010-05-21 -72+9.00 750 6407%cm % 2010-05-21 -72+8.50 747 6387%cm % 2010-05-21 -72+8.00 746 6368%cm % 2010-05-21 -72+7.50 743 6348%cm % 2010-05-21 -72+7.00 740 6329%cm % 2010-05-21 -72+6.50 739 6309%cm % 2010-05-21 -72+6.00 736 6290%cm % 2010-05-21 -72+5.50 734 6193%cm % 2010-05-21 -72+5.00 732 6097%cm % 2010-05-21 -72+4.50 729 6000%cm % 2010-05-21 -72+4.00 725 5904%cm % 2010-05-21 -72+3.50 722 5808%cm % 2010-05-21 -72+3.00 719 5711%cm % 2010-05-21 -72+2.50 714 5615%cm % 2010-05-21 -72+2.00 712 5518%cm % 2010-05-21 -72+1.50 707 5422%cm % 2010-05-21 -72+1.00 702 5326%cm % 2010-05-21 -72+0.50 698 5229%cm % 2010-05-21 -72+0.00 694 5133%cm % 2010-05-20 -96+06 423 1760 % 2010-05-19 -120+06 341 1220 % 2010-05-18 -144+06 297 995 % 2010-05-17 -168+06 299 1010 % 2010-05-16 -192+06 285 938 % 2010-05-15 -216+06 297 995 % 2010-05-14 -240+06 308 1050]; [AX,H1,H2] = plotyy(data(:,1),data(:,2),data(:,1),data(:,3)); grid on title('Pierwsza i druga fala powodziowa w Warszawie. V-VI - 2010.') set(AX(1),'xlim',[-234 488]) set(AX(2),'xlim',[-234 488]) set(AX(2),'ylim',[930 7280]) set(AX(1),'ylim',[280 785]) set(AX(2),'ytick',900:500:7280) set(AX(1),'ytick',280:50:785) set(AX(2),'xtick',[]) set(AX(1),'xtick',-238:24:488) set(AX(2),'gridlinestyle',':') set(AX(2),'ygrid','on') set(get(AX(1),'Ylabel'),'String','poziom wody [cm]') set(get(AX(2),'Ylabel'),'String','przeplyw wody [m^3/s]') set(H1,'LineWidth',2) set(H2,'LineWidth',2) xlabel('data') xtl = {'14.V' [] '16.V' [] '18.V' [] '20.V' [] '22.V' [] '24.V' [] '26.V' []... '28.V' [] '30.V' [] '1.VI' [] '3.VI' [] '5.VI' [] '7.VI' [] '9.VI' [] '11.VI' [] '13.VI'}; set(AX(1),'xticklabel',xtl) legend('poziom wody','przeplyw wody') |
| Date | |
| Source | Own work |
| Author | Grzegorz Knor |
Licensing[edit]
| I, the copyright holder of this work, release this work into the public domain. This applies worldwide. In some countries this may not be legally possible; if so: I grant anyone the right to use this work for any purpose, without any conditions, unless such conditions are required by law. |
File history
Click on a date/time to view the file as it appeared at that time.
| Date/Time | Thumbnail | Dimensions | User | Comment | |
|---|---|---|---|---|---|
| current | 08:26, 13 June 2010 | | 1,280 × 696 (30 KB) | Gknor (talk | contribs) | Aktualizacja - 13.VI.2010 |
| 07:01, 10 June 2010 |  | 1,280 × 876 (35 KB) | Gknor (talk | contribs) | Aktualizacja | |
| 20:09, 8 June 2010 |  | 1,280 × 675 (29 KB) | Gknor (talk | contribs) | Aktualizacja | |
| 20:29, 7 June 2010 |  | 1,280 × 675 (29 KB) | Gknor (talk | contribs) | {{Information |Description={{en|1=State of water in the Vistula River in Warsaw, during the floods of 2010.}} {{pl|1=Stan wody w Wiśle w Warszawie podczas powodzi 2010. Kod w matlabie rysujący wykres: data=[ % 2010-06-07 336+19 673 4900 % 2010-06-07 |
You cannot overwrite this file.
File usage on Commons
There are no pages that use this file.
File usage on other wikis
The following other wikis use this file:
- Usage on pl.wikipedia.org