File:World Map of Y-DNA Haplogroups.png
跳转到导航
跳转到搜索

本预览的尺寸:800 × 507像素。 其他分辨率:320 × 203像素 | 640 × 405像素 | 1,024 × 649像素 | 1,280 × 811像素 | 3,000 × 1,900像素。
原始文件 (3,000 × 1,900像素,文件大小:1.46 MB,MIME类型:image/png)
说明
说明
添加一行文字以描述该文件所表现的内容
摘要
[编辑]
| 描述 |
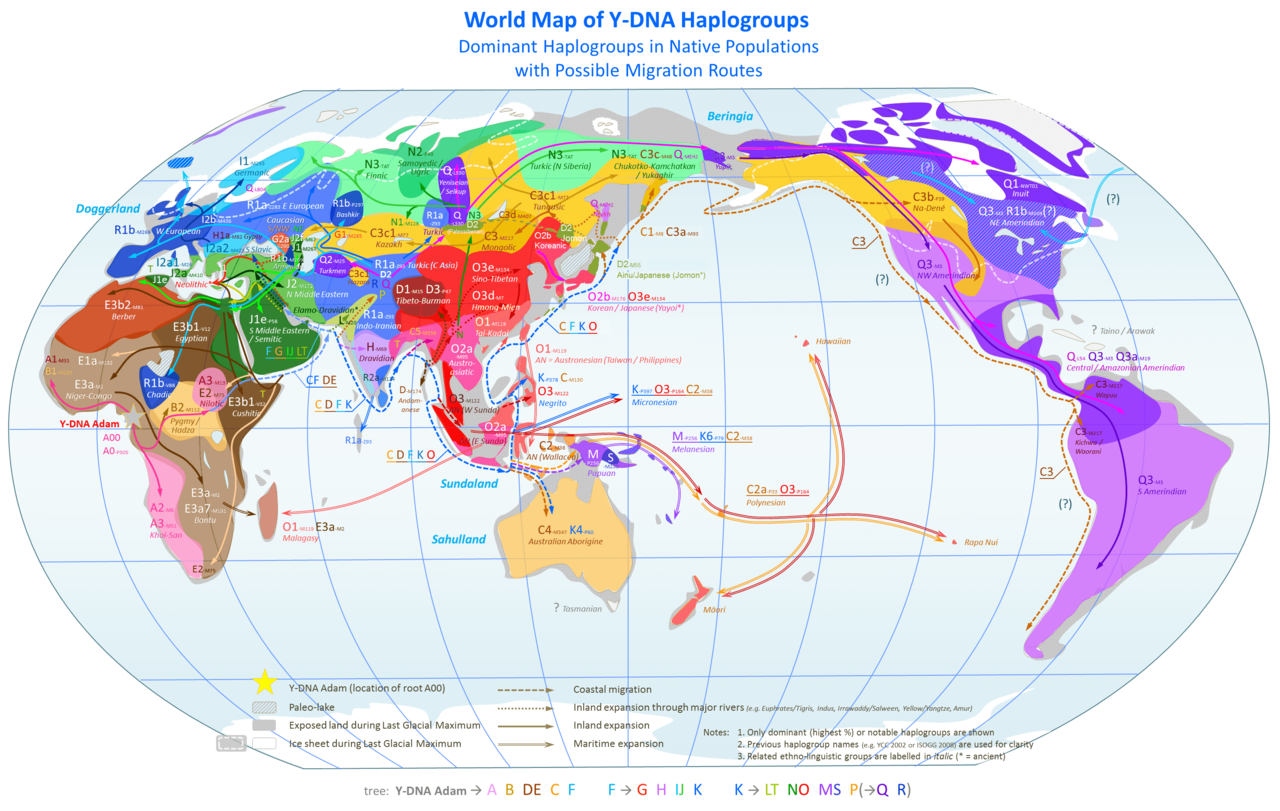
English: World Map of Y-Chromosome Haplogroups - Dominant Haplogroups in Pre-Colonial Populations with Possible Migrations Routes
Notes:
Inspired by Português: Mapa-múndi dos haplogrupos do cromossoma Y: Haplogrupos dominantes nas populações pré-coloniais com as possíveis rotas migratórias.
Notas:
|
| 日期 | |
| 来源 |
Own work based on: |
| 作者 | Chakazul |
.PNG)
.PNG)
.PNG)
.PNG)
.PNG)
.PNG)
.PNG&action=edit&redlink=1)
.PNG)
.PNG)
.PNG)

|
此biogeographical map图片可使用矢量图形重新创建为SVG文件。这具有很多好处;更多信息请参见共享资源:待清理媒体。如果存在此图片的SVG格式,请将其上传,然后将此模板替换为
{{vector version available|新图片名称}}。
建议您将SVG命名为“World Map of Y-DNA Haplogroups.svg”,这样在使用Vector version available(或Vva)模板时就不需要填写新图片名称参数。 |
许可协议
[编辑]
我,本作品著作权人,特此采用以下许可协议发表本作品:

|
已授权您依据自由软件基金会发行的无固定段落及封面封底文字(Invariant Sections, Front-Cover Texts, and Back-Cover Texts)的GNU自由文件许可协议1.2版或任意后续版本的条款,复制、传播和/或修改本文件。该协议的副本请见“GNU Free Documentation License”。 |
本文件采用知识共享署名-相同方式共享 3.0 未本地化版本许可协议授权。
- 您可以自由地:
- 共享 – 复制、发行并传播本作品
- 修改 – 改编作品
- 惟须遵守下列条件:
- 署名 – 您必须对作品进行署名,提供授权条款的链接,并说明是否对原始内容进行了更改。您可以用任何合理的方式来署名,但不得以任何方式表明许可人认可您或您的使用。
- 相同方式共享 – 如果您再混合、转换或者基于本作品进行创作,您必须以与原先许可协议相同或相兼容的许可协议分发您贡献的作品。
您可以选择您需要的许可协议。
文件历史
点击某个日期/时间查看对应时刻的文件。
| 日期/时间 | 缩略图 | 大小 | 用户 | 备注 | |
|---|---|---|---|---|---|
| 当前 | 2019年3月28日 (四) 05:55 | | 3,000 × 1,900(1.46 MB) | Mann Mann(留言 | 贡献) | SibirHusky is an obvious sockpuppet of https://en.wikipedia.org/wiki/Wikipedia:Long-term_abuse/Tirgil34 |
| 2019年1月7日 (一) 22:18 |  | 3,000 × 1,900(1.52 MB) | SibirHusky(留言 | 贡献) | see Peter Underhill map; https://www.nature.com/articles/ejhg201450/figures/3 | |
| 2018年10月15日 (一) 22:51 |  | 3,000 × 1,900(1.46 MB) | Chiorbone da Frittole(留言 | 贡献) | Fix. also in south Italy R1b is 27.5 vs J2 21.5 | |
| 2018年7月25日 (三) 18:49 |  | 3,000 × 1,900(1.52 MB) | Satoshi Kondo(留言 | 贡献) | some other minor fixes, greece is actually J2(38%) E(35%); D2 fix in kyushu; colour fix | |
| 2018年7月18日 (三) 19:39 |  | 3,000 × 1,900(1.53 MB) | Satoshi Kondo(留言 | 贡献) | minor update about y-DNA D2-M55 and own colour as edit for O2b, migration path fix and distribution, i also show the amount of D2 found in siberian/central-asian tuvan/altaian/kyrgyz/mongolic paleosiberians that are another proove of the northern migration of D2. source: 崎谷満(2009)『DNA・考古・言語の学際研究が示す新・日本列島史 日本人集団・日本語の成立史』勉誠出版 | |
| 2018年7月13日 (五) 13:41 |  | 3,000 × 1,900(1.53 MB) | Satoshi Kondo(留言 | 贡献) | the revise you ask for. I created own O2b colour (dark pink) to show difference from O2a. I also included the descedants of goguryeo (and today manchu) who have a high amount of O2b. I changed the Hmong-Mien orange to red as they are a sub-group of O3 and relative close to han. I show the northern viet-O3 and kra-dai O2a in southern china. I show the han in taiwan as O3 on west side. I also included Jeju island to the map. I hope this is ok, if you have other ideas how we can change/fix the m... | |
| 2018年7月9日 (一) 22:24 |  | 3,000 × 1,900(1.53 MB) | Irish1028(留言 | 贡献) | As you said, if the South China is the origin of Y-DNA O2b gene(that is, Yayoi; is the mainstream ethnicity both Korea and Japan), isn't it necessary to supplement?(for example, paint pink to South China). Also, As you can see the text O2b and O2a, the two show significant differences in DNA configuration. So if there is no 02(pink) painting in the South China, they seem to be difficult to understand. Can you make a supplementary revise? | |
| 2018年7月7日 (六) 21:11 |  | 3,000 × 1,900(498 KB) | Satoshi Kondo(留言 | 贡献) | Reverted to version as of 17:33, 7 July 2018 (UTC)THE MAP SHOW THE MAJOR HAPLOGROUP!!!!! ARE YOU NOT ABLE TO READ ENGLISH SENTENCE!? O2B IS 40% O3 ONLY 20% IN HONSHU!!!!! WHAT IS WRONG!? | |
| 2018年7月7日 (六) 21:05 |  | 3,000 × 1,900(1.53 MB) | Irish1028(留言 | 贡献) | appropriate version about japan. admixture of O2b and O3. You stubborn man! Say what you think in discussion. Don't talk here. | |
| 2018年7月7日 (六) 17:33 |  | 3,000 × 1,900(498 KB) | Satoshi Kondo(留言 | 贡献) | Reverted to version as of 15:08, 6 July 2018 (UTC) what you think is not relevant. you are doing POV vandalism. the map CLEALY say MAJOR haplogroups. not minor. this has nothing to do with race. finns have y-DNA N but look predominant nordic and not mongolid. so stop your vandalism. |
您不可以覆盖此文件。
文件用途
以下3个页面使用本文件:
全域文件用途
以下其他wiki使用此文件:
- ar.wikipedia.org上的用途
- bg.wikipedia.org上的用途
- bn.wikipedia.org上的用途
- ckb.wikipedia.org上的用途
- cs.wikipedia.org上的用途
- da.wikipedia.org上的用途
- de.wikipedia.org上的用途
- en.wikipedia.org上的用途
- User:Chakazul
- Haplogroup
- Talk:Haplogroup
- User:UpdatorBen/Brockman
- Human Y-chromosome DNA haplogroup
- Talk:Iranian peoples/Archive 1
- User talk:Maulucioni
- Genetic history of the Indigenous peoples of the Americas
- Recent African origin of modern humans
- File talk:World Map of Y-DNA Haplogroups.png
- Peopling of the Americas
- User:Northamerica1000/Topics
- fa.wikipedia.org上的用途
- fi.wikipedia.org上的用途
- fr.wikipedia.org上的用途
- he.wikipedia.org上的用途
- hy.wikipedia.org上的用途
- id.wikipedia.org上的用途
- it.wikipedia.org上的用途
- ja.wikipedia.org上的用途
查看此文件的更多全域用途。