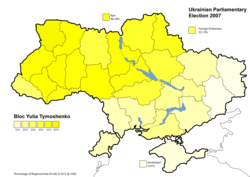
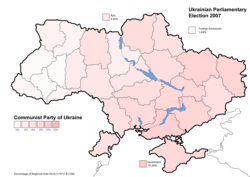
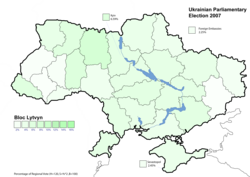
File talk:Ukrainian parliamentary election, 2007 (first place results).PNG
Results Ukrainian Election 2007
[edit] |
 |
друг, how can Lytvyn and the communist be in the non-governing coalition if he didn't wanted to be in the Party of region shadow cabinet [[1]]. Sorry, your chart is nonsense... Mariah-Yulia (talk) 21:39, 7 February 2008 (UTC)
- Because they are not party of the Governing coalition. I did not refer to them as opposition just non-Governing Coalition The above is just one of the various options available BUT it never the less shows more accurately the results of the election and the relationship between the various parties where the map does not. The first place and second place maps are false and misleading. They only show a distorted presentation of the geo-political landscape without taking into consideration the percentage or actual level of voter support. (Quantity of votes)
The color graded/shaded scale maps and charts show not only the geographical location of each region but also the scale and percentage of vote The First place map could have a better choice of colors also. The dark red for BYUT is not a good choice and the blue allocated to Party of Regions should be the same as the Ukrainian Flag which is the color PoR uses. Yellow is close to orange and more brighter over-all. It all adds to the presentation of accurate information. Which after all is what we should be striving to achieve in a NPOV publication.
Maps and charts
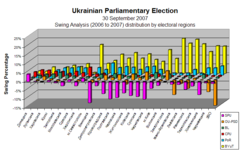
[edit]There is no statistic merit in publishing the second highest polling party. A region can have 90% support for one party and the second place represent 5% or it could be 45% for one party and the second place 42%. This is a proportional ballot it is not first past the post. If need be I suggest you update the map and record the percentage of each winning party for each region as was published for the 2006 election. The second place map has no encyclopedic value. I have included a Swing analysis chart based on the official published results.
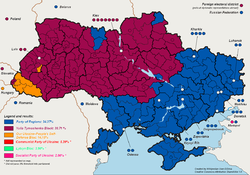 |
Both the first place and the second place map is very misleading as it gives the false impression that Our Ukraine's votes is greater the it actually is. Ukraine uses a proportional representation voting system. It is not first-past-the-post, as such there is no second place winner. The second highest vote is also misleading as it does not take into consideration the demographic population density. The first place (Highest vote map has some interest but seriously needs review. A better option would be to produce a color graded map for each party based on the number of votes received in each district/region as exist for the 2006 election article.
Compare the map with the chart below. Perhaps they need to also present a third and fourth place map. Somehow I think the reason for the publication of the second place map is more to do bias editing and an attempt to promote one political party and not the facts. NPOV - LET THE FACTS SPEAK FOR THEMSELVES. Fact is our Ukraine received only 14% of the overall vote yet the second place map gives you the impression they received much more. There is no statistical merit in either map as it is presented and even less with the second place map.
In Politics, runners-up only applies to single member electorates or parties using a first past-the-post voting systems, such as Great Britain, the United States of America, Canada or Australia's House of Representatives. It does not apply to multi-member proportional representation electorates such as exists in Ireland, Ukraine and many European countries or Australia's Senate elections.
The parties depicted are not Runners-up as they won seats. In the same way they are not second place as there is no placing in a proportional representation count. In some regions the so called first-place (highest vote party) received over 70 percent of the vote and the so called second place runner-up received only 5%. In other regions the first place (highest vote) party received 34% and the second place "runner-up" could have received 33% and the third place winner 32%. The map as displayed seriously distorts the presetation of the results of the election and does not represent the overall election results where the charts do.
If you look closely at the "runner-up" "second place" map and compare it with the "first place" (highest vote) map, you will notice a number of serious mistakes in the presentation of the data (Mistakes do happen) in some cases the party presented for a given area appears as both "first place" and "second place" winner.
A mixture of both charts and maps (redrawn to accurately reflect the results) should be used if we are to present a full and accurate presentation of the election results. Some editors are showing a lack of professionalism and or bias in their assessment to support one particular party or blocs.
 |

|
 |
 |

|

|
|
2006 [7] [8] [9] [10] [11] [12]
A swing analysis is common in any election. It shows the change in voter percentage for each party by regions from 2006 to 2007.

