File:Countries by Military expenditures (% of GDP) in 2014 v2.svg
Jump to navigation
Jump to search

Size of this PNG preview of this SVG file: 512 × 288 pixels. Other resolutions: 320 × 180 pixels | 640 × 360 pixels | 1,024 × 576 pixels | 1,280 × 720 pixels | 2,560 × 1,440 pixels.
Original file (SVG file, nominally 512 × 288 pixels, file size: 1.52 MB)
Captions
Captions
Add a one-line explanation of what this file represents
Summary[edit]
_in_2014_v2.svg&action=edit§ion=1)
| Description |
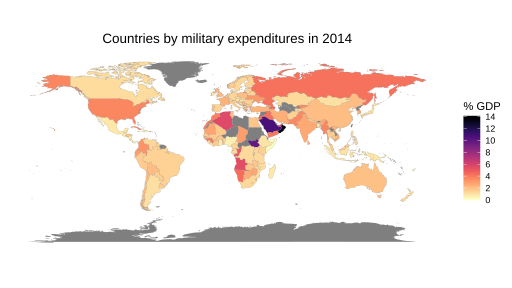
English: Based on the Worldbank data from http://data.worldbank.org/indicator/MS.MIL.XPND.GD.ZS
This is an intentional duplicate of https://commons.wikimedia.org/wiki/File:Countries_by_Military_expenditures_(%25_of_GDP)_in_2014.svg created with freely available R packages (so that it can be recreated effortlessly). |
| Date | |
| Source | Created with R |
| Author | Pipping |
_in_2014.svg)
Licensing[edit]
_in_2014_v2.svg&action=edit§ion=2)
I, the copyright holder of this work, hereby publish it under the following license:
This file is licensed under the Creative Commons Attribution-Share Alike 4.0 International license.
- You are free:
- to share – to copy, distribute and transmit the work
- to remix – to adapt the work
- Under the following conditions:
- attribution – You must give appropriate credit, provide a link to the license, and indicate if changes were made. You may do so in any reasonable manner, but not in any way that suggests the licensor endorses you or your use.
- share alike – If you remix, transform, or build upon the material, you must distribute your contributions under the same or compatible license as the original.
Created with the following piece of code:
library(magrittr)

selectedYear <- 2014

getWorldBankData <- function(indicatorCode, indicatorName) {
    baseName <- paste('API', indicatorCode, 'DS2_en_csv_v2', sep='_')
    ## Download zipfile if necessary
    zipfile <- paste(baseName, 'zip', sep='.')
    if (!file.exists(zipfile)) {
        zipurl <- paste(paste('http://api.worldbank.org/v2/en/indicator',
                              indicatorCode, sep='/'),
                        'downloadformat=csv', sep='?')
        download.file(zipurl, zipfile)
    }
    csvfile <- paste(baseName, 'csv', sep='.')
    ## This produces a warning because of the trailing commas. Safe to ignore.
    readr::read_csv(unz(zipfile, csvfile), skip=4,
                    col_types = list(`Indicator Name` = readr::col_character(),
                                     `Indicator Code` = readr::col_character(),
                                     `Country Name` = readr::col_character(),
                                     `Country Code` = readr::col_character(),
                                     .default = readr::col_double())) %>%
        dplyr::select(-c(`Indicator Name`, `Indicator Code`, `Country Name`))
}

## Obtain and merge World Bank data
worldBankData <- getWorldBankData('MS.MIL.XPND.GD.ZS') %>%
    tidyr::gather(-`Country Code`, convert=TRUE,
                  key='Year', value=`Military expenditure (% of GDP)`,
                  na.rm = TRUE) %>%
    dplyr::filter(Year == selectedYear) %>%
    dplyr::mutate(Year = NULL)

## Plotting: Obtain Geographic data
mapData <- tibble::as.tibble(ggplot2::map_data("world")) %>%
    dplyr::mutate(`Country Code` =
                      countrycode::countrycode(region, "country.name", "iso3c"),
                  ## This produces a warning but I do not see how we could do better
                  ## since we started with fuzzy names.
                  region = NULL, subregion = NULL)

combinedData <- dplyr::left_join(mapData, worldBankData)

ggplot2::ggplot(data = combinedData, ggplot2::aes(long,lat)) +
    ggplot2::geom_polygon(ggplot2::aes(group = group,
                                       fill  = `Military expenditure (% of GDP)`),
                          color = '#606060', lwd=0.05) +
    ggplot2::scale_fill_gradientn(colours= rev(viridis::magma(256, alpha = 0.5)),
                                  name = "% GDP",
                                  breaks = 2*0:50,
                                  limits = c(0,14)) +
    ggplot2::coord_fixed() +
    ggplot2::theme_bw() +
    ggplot2::theme(plot.title = ggplot2::element_text(hjust = 0.5),
          axis.title = ggplot2::element_blank(),
          axis.text = ggplot2::element_blank(),
          axis.ticks = ggplot2::element_blank(),
          panel.grid.major = ggplot2::element_blank(),
          panel.grid.minor = ggplot2::element_blank(),
          panel.border = ggplot2::element_blank(),
          panel.background = ggplot2::element_blank()) +
    ggplot2::labs(title = paste("Countries by military expenditures in",
                                selectedYear))

ggplot2::ggsave(paste(selectedYear, 'militrary_expenditures_relative.svg', sep='_'),
                height=100, units='mm')
File history
Click on a date/time to view the file as it appeared at that time.
| Date/Time | Thumbnail | Dimensions | User | Comment | |
|---|---|---|---|---|---|
| current | 14:30, 20 May 2017 | | 512 × 288 (1.52 MB) | Pipping (talk | contribs) | redo with dplyr |
| 20:27, 11 May 2017 |  | 512 × 256 (1.51 MB) | Pipping (talk | contribs) | Regenerated with new data (last update upstream: 2017-04-27). | |
| 19:07, 14 December 2016 |  | 512 × 256 (1.51 MB) | Pipping (talk | contribs) | Fixed scale for easier comparison with data from different years | |
| 18:43, 14 December 2016 |  | 512 × 256 (1.51 MB) | Pipping (talk | contribs) | Use a more appropriate resolution (makes the font smaller in relation) | |
| 17:10, 14 December 2016 |  | 512 × 271 (1.49 MB) | Pipping (talk | contribs) | {{subst:Upload marker added by en.wp UW}} {{Information |Description = {{en|Based on the Worldbank data from http://data.worldbank.org/indicator/MS.MIL.XPND.GD.ZS This is an intentional duplicate of https://commons.wikimedia.org/wiki/File:Countries_by... |
You cannot overwrite this file.
File usage on Commons
There are no pages that use this file.
File usage on other wikis
The following other wikis use this file:
- Usage on bg.wikipedia.org
- Usage on bn.wikipedia.org
- Usage on en.wikipedia.org
- Usage on sr.wikipedia.org
- Usage on th.wikipedia.org
- Usage on uk.wikipedia.org
_in_2014_v2.svg&oldid=870105555)