File:Economics Gini coefficient2.svg
Vai alla navigazione
Vai alla ricerca

Dimensioni di questa anteprima PNG per questo file SVG: 500 × 500 pixel. Altre risoluzioni: 240 × 240 pixel | 480 × 480 pixel | 768 × 768 pixel | 1 024 × 1 024 pixel | 2 048 × 2 048 pixel.
File originale (file in formato SVG, dimensioni nominali 500 × 500 pixel, dimensione del file: 2 KB)
Didascalie
Didascalie
Aggiungi una brevissima spiegazione di ciò che questo file rappresenta
Dettagli[modifica]
| Descrizione |
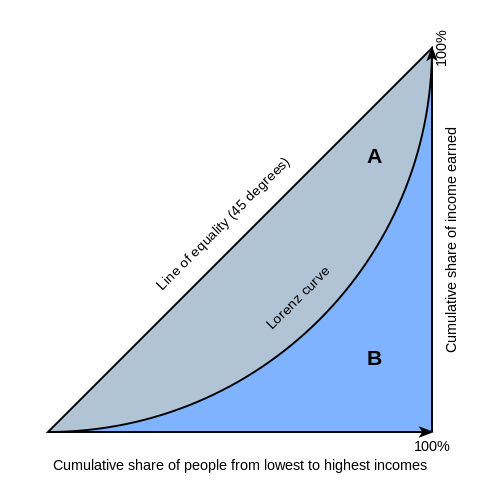
English: Gini coefficient diagram, based on the version by Bluemoose/BenFrantzDale. You can think of the horizontal axis as percent of people and the vertical axis as the percent of income those people receive. Therefore the Lorenz curves always start and end at the same places, where 0% of people make 0% of the country's income and 100% of people make 100% of the total income.
Inequality is implied when the curve is below the 45-degree line: At the left, the percentage of people is higher than the percent of income they receive (i.e. 10% of the people getting 5% of the total income); at the right, the percent of income received rises more than the percent of people receiving it. The area above the Lorenz curve -- marked "A" -- is shaded differently from the area below the curve -- marked "B". This simplifies the mathematical explanation of the gini coefficient, which is A/(A+B) |
| Data | |
| Fonte | The original file was on WikiMedia Commons (http://en.wikipedia.org/wiki/File:Economics_Gini_coefficient.svg). I have edited the file. |
| Autore | Reidpath |
| Altre versioni | Opere derivate da questo file: Economics Gini coefficient2-ar.svg |
Licenza[modifica]
Questa immagine non possiede i requisiti per essere tutelabile dalle leggi sul diritto d’autore ed è quindi in pubblico dominio in quanto costituita da elementi del patrimonio comune. Testo in caratteri generici e forme geometriche semplici non sono protetti da diritto d’autore.
|
Cronologia del file
Fare clic su un gruppo data/ora per vedere il file come si presentava nel momento indicato.
| Data/Ora | Miniatura | Dimensioni | Utente | Commento | |
|---|---|---|---|---|---|
| attuale | 18:00, 6 mar 2021 | | 500 × 500 (2 KB) | Nyq (discussione | contributi) | decapitalized common nouns |
| 16:52, 20 mar 2016 |  | 500 × 500 (2 KB) | Wylve (discussione | contributi) | Fixed CSS | |
| 16:51, 20 mar 2016 |  | 500 × 500 (2 KB) | Wylve (discussione | contributi) | Reduce tracing artifacts | |
| 15:18, 24 giu 2009 |  | 500 × 500 (7 KB) | Reidpath (discussione | contributi) | {{Information |Description={{en|1=Gini coefficient diagram, based on the version by Bluemoose/BenFrantzDale. You can think of the horizontal axis as percent of people and the vertical axis as the percent of income those people receive. Therefore the Loren |
Impossibile sovrascrivere questo file.
Utilizzo del file
Le seguenti 6 pagine usano questo file:
Utilizzo globale del file
Anche i seguenti wiki usano questo file:
- Usato nelle seguenti pagine di af.wikipedia.org:
- Usato nelle seguenti pagine di ar.wikipedia.org:
- Usato nelle seguenti pagine di bh.wikipedia.org:
- Usato nelle seguenti pagine di bn.wikipedia.org:
- Usato nelle seguenti pagine di en.wikipedia.org:
- Gini coefficient
- Lorenz curve
- Poverty
- Portal:Mathematics/Featured picture archive
- Wikipedia:Reference desk/Archives/Humanities/2010 December 18
- Portal:Mathematics/Featured picture/2012 08
- Wikipedia:Village pump (technical)/Archive 106
- Portal:Mathematics/Selected picture
- Portal:Mathematics/Selected picture/11
- User:Lexsta/sandbox
- Usato nelle seguenti pagine di et.wikipedia.org:
- Usato nelle seguenti pagine di fa.wikipedia.org:
- Usato nelle seguenti pagine di he.wikipedia.org:
- Usato nelle seguenti pagine di it.wikipedia.org:
- Usato nelle seguenti pagine di ja.wikipedia.org:
- Usato nelle seguenti pagine di km.wikipedia.org:
- Usato nelle seguenti pagine di la.wikipedia.org:
- Usato nelle seguenti pagine di ms.wikipedia.org:
- Usato nelle seguenti pagine di nl.wikipedia.org:
- Usato nelle seguenti pagine di ro.wikipedia.org:
- Usato nelle seguenti pagine di si.wikipedia.org:
- Usato nelle seguenti pagine di sq.wikipedia.org:
- Usato nelle seguenti pagine di sr.wikipedia.org:
- Usato nelle seguenti pagine di te.wikipedia.org:
- Usato nelle seguenti pagine di ur.wikipedia.org: