File:Hours of Output Deutscher Fernsehfunk.svg
Vai alla navigazione
Vai alla ricerca

Dimensioni di questa anteprima PNG per questo file SVG: 600 × 480 pixel. Altre risoluzioni: 300 × 240 pixel | 960 × 768 pixel | 1 280 × 1 024 pixel | 2 560 × 2 048 pixel.
File originale (file in formato SVG, dimensioni nominali 600 × 480 pixel, dimensione del file: 8 KB)
Didascalie
Didascalie
Aggiungi una brevissima spiegazione di ciò che questo file rappresenta
Dettagli
[modifica]
| Descrizione |
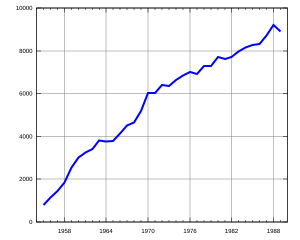
Deutsch: Diagramm zeigt die Anzahl der jährlichen Sendestunden des Deutschen Fernsehfunks.
English: Diagram shows the hours of output of the former east german television Deutscher Fernsehfunk. |
| Data | 03.12.2005 |
| Fonte |
Deutsch: Diagramm von mir erstellt mit Gnuplot, für Skripte und Daten s.u.
English: Diagram drawn by myself with Gnuplot, see script and data below |
| Autore | Dabbelju |
| Licenza (Riusare questo file) |
GFDL |
Source Files
[modifica]
English: To update the diagram, save the dat and plt file in separate text-files and modify the data in the way you want. Then call "gnuplot Hours_of_Output_Deutscher_Fernsehfunk.plt" (under Windows you can start the GUI with wgnuplot and then open the file) and a new SVG file has been created.
Deutsch: Um ein Diagramm zu aktualisieren, speichere die dat- und plt-Datei in Text-Dateien und modifiziere die Daten entsprechend. Dann rufe "gnuplot Hours_of_Output_Deutscher_Fernsehfunk.plt" auf (unter Windows kann auch wgnuplot gestartet und dann diese Datei über die grafische Oberfläche geöffnet werden) und eine neue SVG Datei wurde generiert.
Data File "Hours_of_Output_Deutscher_Fernsehfunk.dat"
[modifica]
# Deutscher Fernsehfunk / Television of GDR
# -----------------------------------------
# Anzahl der Sendestunden pro Jahr von 1955 bis 1989
# Number of hours of output per year from 1955 until 1989
# Quelle/Source: Statistisches Jahrbuch der DDR 1990

1955 786
1956 1138
1957 1448
1958 1855
1959 2539
1960 3007
1961 3259
1962 3420
1963 3807
1964 3767
1965 3774
1966 4142
1967 4514
1968 4642
1969 5193
1970 6028
1971 6038
1972 6402
1973 6360
1974 6634
1975 6851
1976 7020
1977 6905
1978 7290
1979 7283
1980 7704
1981 7610
1982 7716
1983 7962
1984 8163
1985 8265
1986 8320
1987 8706
1988 9194
1989 8900
Gnuplot Script "Hours_of_Output_Deutscher_Fernsehfunk.plt"
[modifica]
set encoding iso_8859_1
set terminal svg
set output 'Hours_of_Output_Deutscher_Fernsehfunk.svg'

set xdata time
set timefmt "%Y"

set xrange ["1954":"1990"]
set yrange [0:10000]

set format x "%Y"
set grid

plot 'Hours_of_Output_Deutscher_Fernsehfunk.dat' using 1:2 notitle with lines lt 3 lw 4
Licenza
[modifica]
Io, detentore del copyright su quest'opera, dichiaro di pubblicarla con le seguenti licenze:

|
È permesso copiare, distribuire e/o modificare questo documento in base ai termini della GNU Free Documentation License, Versione 1.2 o successive pubblicata dalla Free Software Foundation; senza alcuna sezione non modificabile, senza testo di copertina e senza testo di quarta di copertina. Una copia della licenza è inclusa nella sezione intitolata Testo della GNU Free Documentation License. |
| Questo file è disponibile in base alla licenza Creative Commons Attribuzione-Condividi allo stesso modo 3.0 Unported | ||
| ||
| Questo tag di copyright è stato aggiunto nell'ambito dell'aggiornamento della licenza dei progetti Wikimedia. |
Puoi scegliere la licenza che preferisci.
Cronologia del file
Fare clic su un gruppo data/ora per vedere il file come si presentava nel momento indicato.
| Data/Ora | Miniatura | Dimensioni | Utente | Commento | |
|---|---|---|---|---|---|
| attuale | 01:56, 4 dic 2005 | | 600 × 480 (8 KB) | Dabbelju (discussione | contributi) | == Description == * {{english}} {{Information| |Description = Diagram shows the hours of output of the east german television en:Deutscher Fernsehfunk. |Source = Diagram drawn by myself with Gnuplot, see script and data below |Date = |
Impossibile sovrascrivere questo file.
Utilizzo del file
Nessuna pagina utilizza questo file.
Utilizzo globale del file
Anche i seguenti wiki usano questo file:
- Usato nelle seguenti pagine di af.wikipedia.org:
- Usato nelle seguenti pagine di de.wikipedia.org:
- Usato nelle seguenti pagine di en.wikipedia.org:
- Usato nelle seguenti pagine di fr.wikipedia.org:
- Usato nelle seguenti pagine di it.wikipedia.org:
- Usato nelle seguenti pagine di vi.wikipedia.org:
- Usato nelle seguenti pagine di zh.wikipedia.org: