File:Piecharts.svg
קפיצה לניווט
קפיצה לחיפוש

גודל התצוגה המקדימה הזאת מסוג PNG של קובץ ה־SVG הזה: 689 × 494 פיקסלים. רזולוציות אחרות: 320 × 229 פיקסלים | 640 × 459 פיקסלים | 1,024 × 734 פיקסלים | 1,280 × 918 פיקסלים | 2,560 × 1,835 פיקסלים.
לקובץ המקורי (קובץ SVG, הגודל המקורי: 689 × 494 פיקסלים, גודל הקובץ: 39 ק"ב)
כיתובים
כיתובים
נא להוסיף משפט שמסביר מה הקובץ מייצג
תקציר
[עריכה]
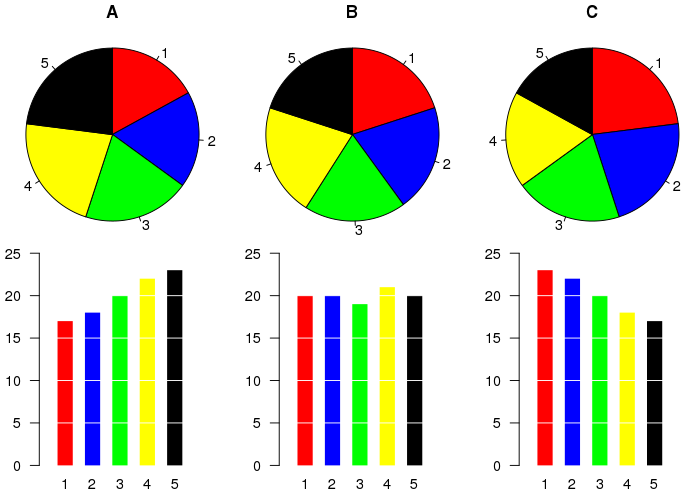
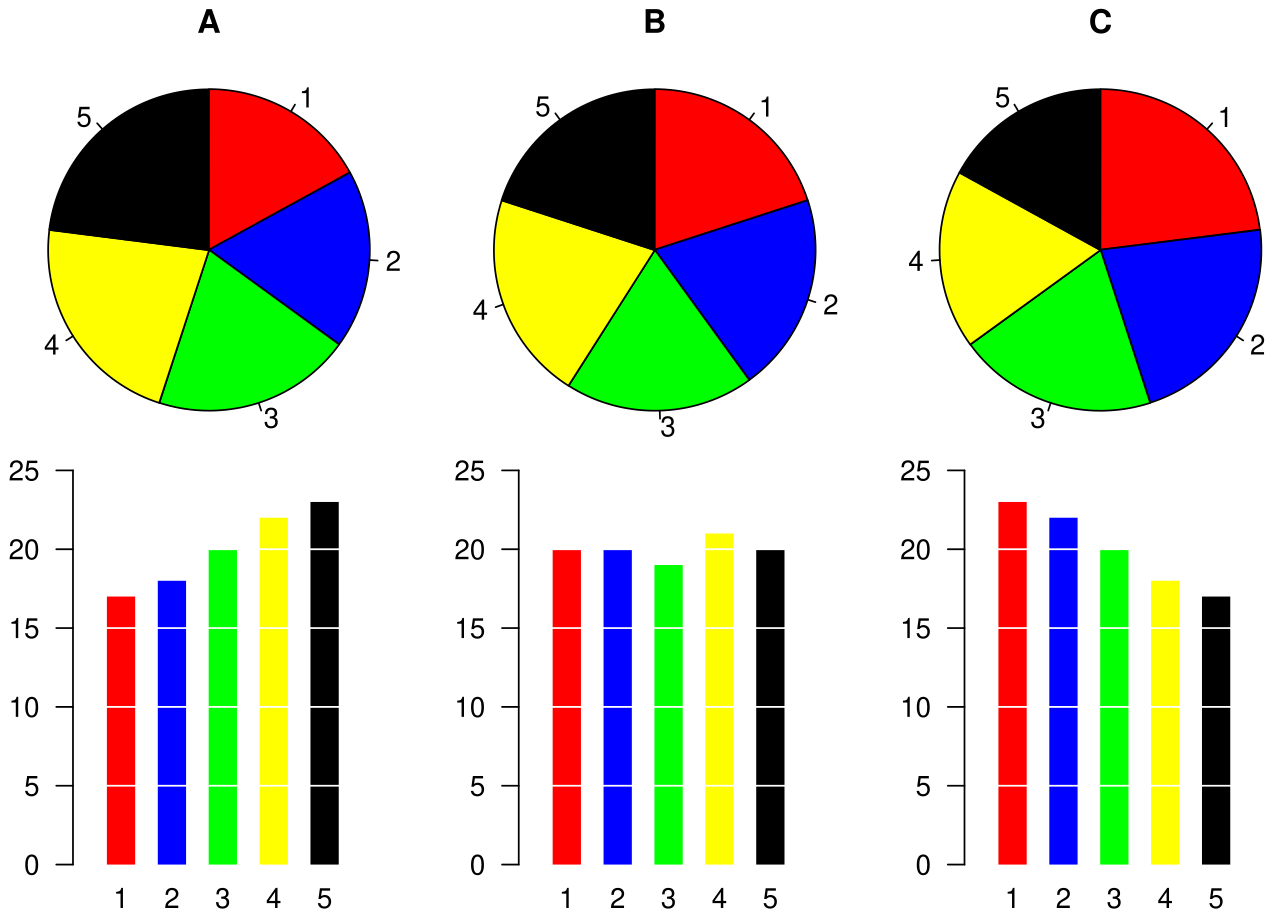
Example of a pie chart, along with a bar plot showing the same data and indicating that the pie chart is not the best possible chart for this particular dataset.
The graphic was created by User:Schutz for Wikipedia on 28 August 2007 using the R statistical project. The program that generated the graphic is given below. The graph was exported in postscript format, converted to SVG using the pstoedit command, and the layout was slightly modified using Inkscape before upload.
+pstoedit+Inkscape: v מאת R עם נוצרה ה גרפיקה וקטורית
רישיון
[עריכה]
הקובץ הזה מתפרסם לפי תנאי רישיון קריאייטיב קומונז ייחוס 1.0 כללי.
- הנכם רשאים:
- לשתף – להעתיק, להפיץ ולהעביר את העבודה
- לערבב בין עבודות – להתאים את העבודה
- תחת התנאים הבאים:
- ייחוס – יש לתת ייחוס הולם, לתת קישור לרישיון, ולציין אם נעשו שינויים. אפשר לעשות את זה בכל צורה סבירה, אבל לא בשום צורה שמשתמע ממנה שמעניק הרישיון תומך בך או בשימוש שלך.
היסטוריית הקובץ
ניתן ללחוץ על תאריך/שעה כדי לראות את הקובץ כפי שנראה באותו זמן.
| תאריך/שעה | תמונה ממוזערת | ממדים | משתמש | הערה | |
|---|---|---|---|---|---|
| נוכחית | 08:33, 28 באוגוסט 2007 | | 494 × 689 (39 ק"ב) | Schutz (שיחה | תרומות) | == Summary == Example of a pie chart, along with a bar plot showing the same data and indicating that the pie chart is not the best possible chart for this particular dataset. The graphic was created by User:Schutz for Wikipedia on 28 August 2007 usi |
אין באפשרותך לדרוס את הקובץ הזה.
שימוש בקובץ
הדפים הבאים משתמשים בקובץ הזה:
שימוש גלובלי בקובץ
אתרי הוויקי השונים הבאים משתמשים בקובץ זה:
- שימוש באתר cy.wikipedia.org
- שימוש באתר el.wikipedia.org
- שימוש באתר en.wikipedia.org
- שימוש באתר eu.wikipedia.org
- שימוש באתר fi.wikipedia.org
- שימוש באתר he.wikipedia.org
- שימוש באתר he.wikibooks.org
- שימוש באתר ja.wikipedia.org
- שימוש באתר pl.wikipedia.org
- שימוש באתר pt.wikipedia.org
- שימוש באתר ta.wikipedia.org
- שימוש באתר tr.wikipedia.org
- שימוש באתר uk.wikipedia.org
- שימוש באתר zh.wikipedia.org