File:RATE DE EȘANTIONARE.SVG
Jump to navigation
Jump to search

Size of this PNG preview of this SVG file: 500 × 378 pixels. Other resolutions: 318 × 240 pixels | 635 × 480 pixels | 1,016 × 768 pixels | 1,280 × 968 pixels | 2,560 × 1,935 pixels.
Original file (SVG file, nominally 500 × 378 pixels, file size: 25 KB)
Captions
Captions
Add a one-line explanation of what this file represents
Summary
[edit]
| Description |
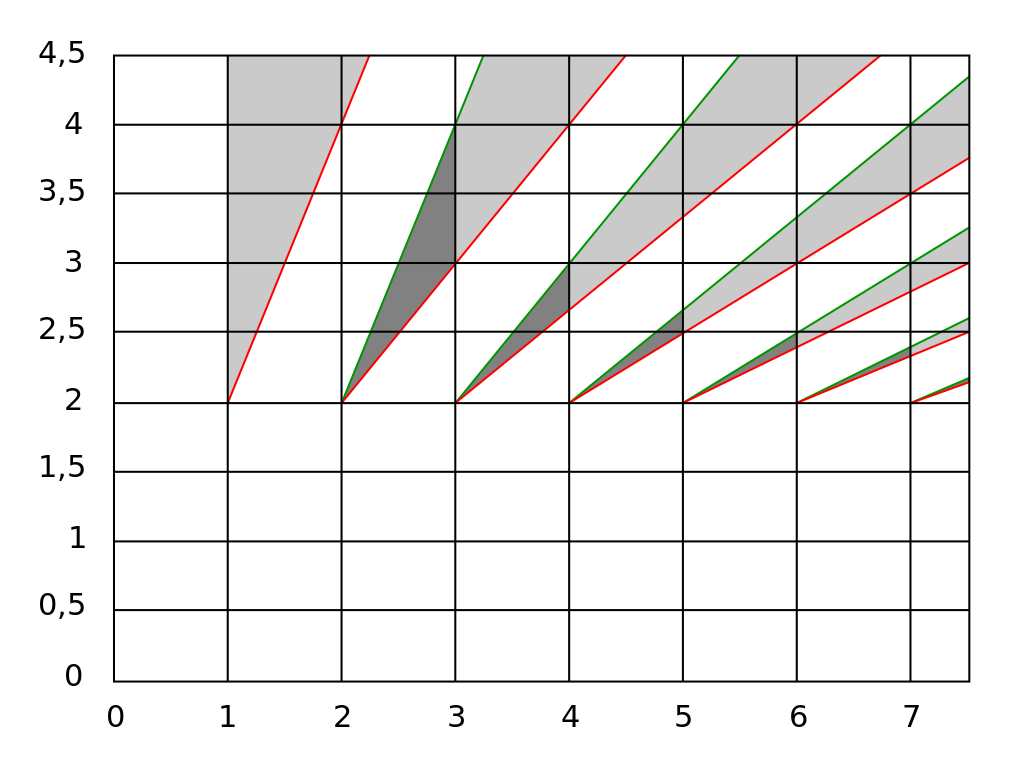
English: Plot of acceptable sample rates versus upper edge of band, for bandwidth 1, according to formulae from Nyquist–Shannon sampling theorem. The original image was made in MATLAB with region coloring in Photoshop and the present vectorized image was made in Inkscape.
Română: Grafic al ratelor de eșantionare acceptabile față de frecvența limită superioară, pentru o lățime de bandă 1, potrivit formulelor teoremei eșantionării Nyquist–Shannon. Imaginea originală a fost realizată în MATLAB cu colorarea regiunilor în Photoshop iar imaginea vectorizată de față a fost realizată în Inkscape. |
| Date | 9 January 2011 |
| Source | Samplerates.png |
| Author |
Dick Lyon (original) ANDROBETA (vector) |
| Other versions |
|
Licensing
[edit]
| |
This work has been released into the public domain by its author, Dicklyon, at the English Wikipedia project. This applies worldwide. In case this is not legally possible: |
File history
Click on a date/time to view the file as it appeared at that time.
| Date/Time | Thumbnail | Dimensions | User | Comment | |
|---|---|---|---|---|---|
| current | 18:01, 17 July 2011 | | 500 × 378 (25 KB) | ANDROBETA (talk | contribs) | I'm confused... :/ |
| 17:41, 17 July 2011 |  | 500 × 378 (24 KB) | ANDROBETA (talk | contribs) | Enlarge numbers | |
| 17:05, 17 July 2011 |  | 500 × 378 (24 KB) | ANDROBETA (talk | contribs) | Correction attempt | |
| 22:16, 9 January 2011 |  | 542 × 378 (27 KB) | ANDROBETA (talk | contribs) | Corectare minoră | |
| 22:07, 9 January 2011 |  | 542 × 378 (27 KB) | ANDROBETA (talk | contribs) | == {{int:filedesc}} == {{Information |Description= {{en|Plot of acceptable sample rates versus upper edge of band, for bandwidth 1, according to formulae from Nyquist–Shannon sampling theorem. Made in |
You cannot overwrite this file.
File usage on Commons
There are no pages that use this file.
File usage on other wikis
The following other wikis use this file:
- Usage on ro.wikipedia.org