File:U.S. Historical Population.svg
Jump to navigation
Jump to search

Size of this PNG preview of this SVG file: 626 × 365 pixels. Other resolutions: 320 × 187 pixels | 640 × 373 pixels | 1,024 × 597 pixels | 1,280 × 746 pixels | 2,560 × 1,493 pixels.
Original file (SVG file, nominally 626 × 365 pixels, file size: 48 KB)
Captions
Captions
Add a one-line explanation of what this file represents
Summary[edit]
| Description |
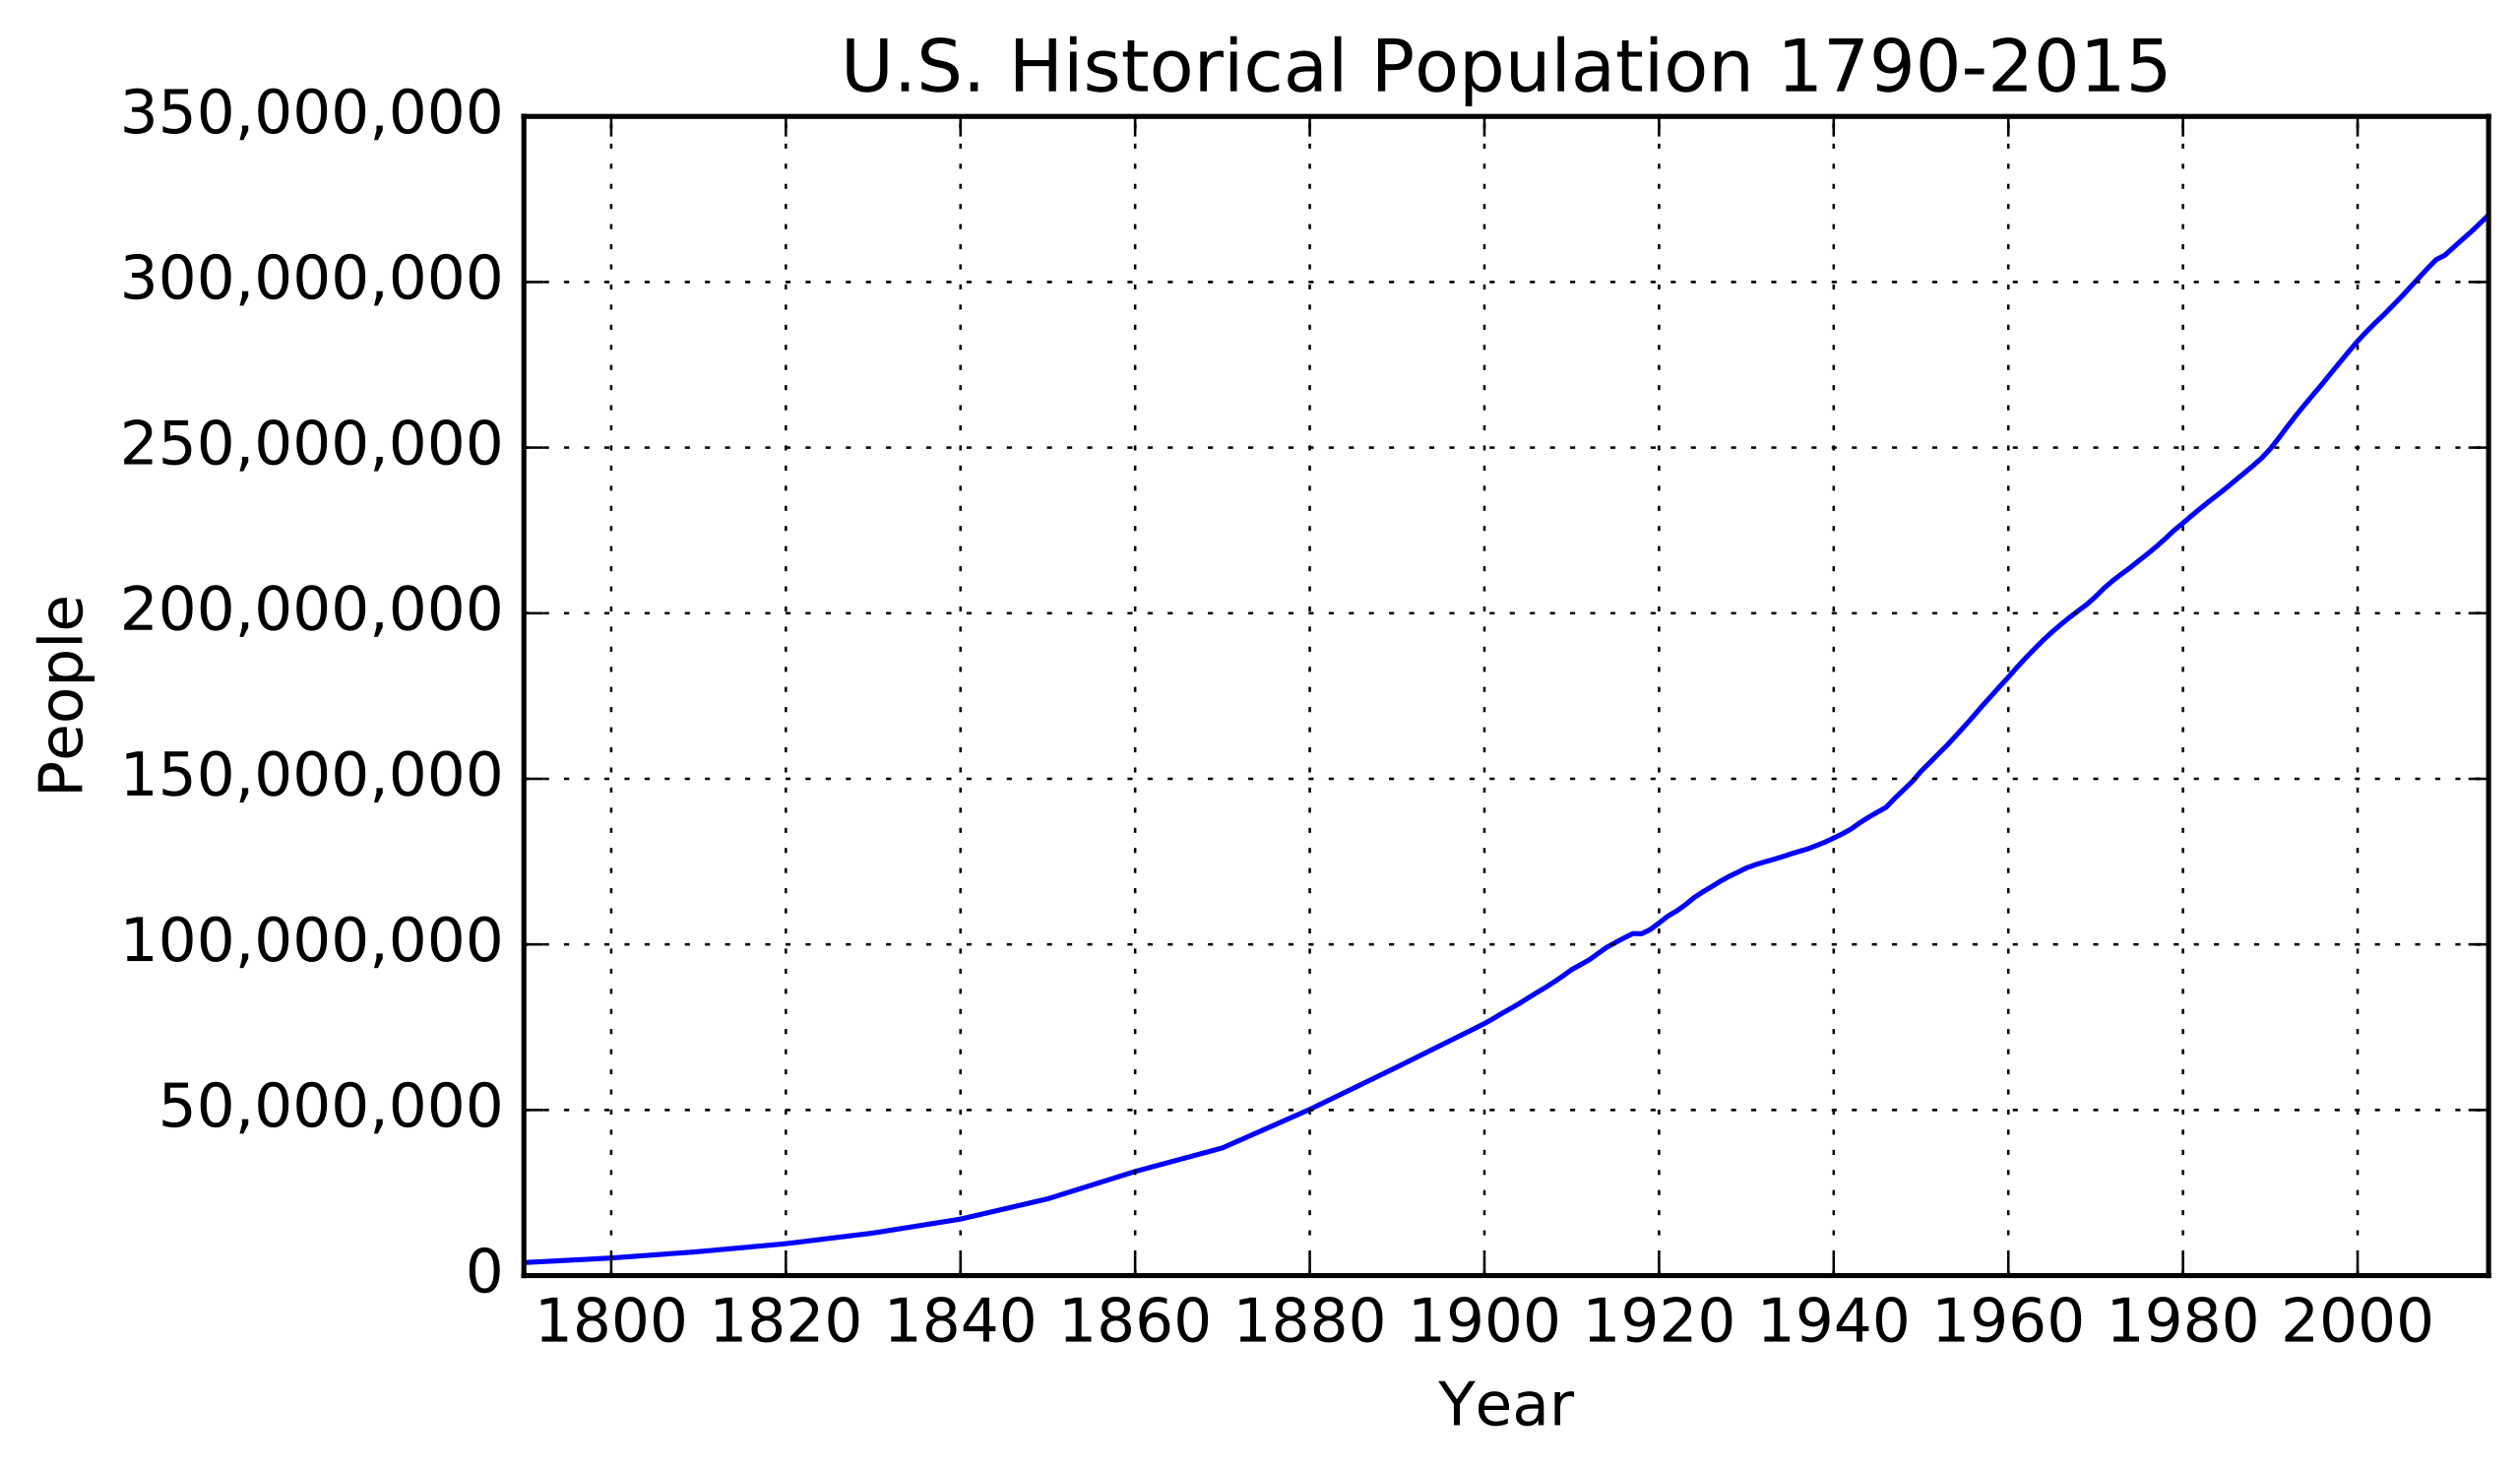
English: This graph shows the population of the United States over time. Data spans 1790-2015 and is from the U.S. Census. For 1790 to 1890, data is in ten year increments. For 1900 to the present, it is in annual increments. |
| Date | |
| Source | Own work |
| Author | Douglas Perkins |
The SVG file was produced using MatPlotLib with the following (also Public Domain) code.
#!/usr/bin/env python

from matplotlib import pyplot
from matplotlib import ticker
from matplotlib import numpy

# This generates a line graph showing the population of the U.S.
#
# Data spans 1790-2015 and is from the U.S. Census.
# For 1790 to 1890, data is in ten year increments.
# For 1900 to the present, it is in annual increments.
#
# 1790-1890: http://www.u-s-history.com/pages/h980.html
# 1900-present: http://www.multpl.com/united-states-population/table
#
# This file was written by Douglas Perkins.
# It is released under a Creative Commons Zero 1.0 dedication.
#
# https://creativecommons.org/publicdomain/zero/1.0/

data = [
(1790, 3929214),
(1800, 5308483),
(1810, 7239881),
(1820, 9638453),
(1830, 12860702),
(1840, 17063353),
(1850, 23191876),
(1860, 31443321),
(1870, 38558371),
(1880, 50189209),
(1890, 62979766),
(1900, 76090000),
(1901, 77580000),
(1902, 79160000),
(1903, 80630000),
(1904, 82170000),
(1905, 83820000),
(1906, 85450000),
(1907, 87010000),
(1908, 88710000),
(1909, 90490000),
(1910, 92410000),
(1911, 93860000),
(1912, 95340000),
(1913, 97230000),
(1914, 99110000),
(1915, 100550000),
(1916, 101960000),
(1917, 103270000),
(1918, 103210000),
(1919, 104510000),
(1920, 106460000),
(1921, 108540000),
(1922, 110050000),
(1923, 111950000),
(1924, 114110000),
(1925, 115830000),
(1926, 117400000),
(1927, 119040000),
(1928, 120510000),
(1929, 121770000),
(1930, 123080000),
(1931, 124040000),
(1932, 124840000),
(1933, 125580000),
(1934, 126370000),
(1935, 127250000),
(1936, 128050000),
(1937, 128820000),
(1938, 129820000),
(1939, 130880000),
(1940, 132120000),
(1941, 133400000),
(1942, 134860000),
(1943, 136740000),
(1944, 138400000),
(1945, 139930000),
(1946, 141390000),
(1947, 144130000),
(1948, 146630000),
(1949, 149190000),
(1950, 152270000),
(1951, 154880000),
(1952, 157550000),
(1953, 160180000),
(1954, 163030000),
(1955, 165930000),
(1956, 168900000),
(1957, 171980000),
(1958, 174880000),
(1959, 177830000),
(1960, 180670000),
(1961, 183690000),
(1962, 186540000),
(1963, 189240000),
(1964, 191890000),
(1965, 194300000),
(1966, 196560000),
(1967, 198710000),
(1968, 200710000),
(1969, 202680000),
(1970, 205050000),
(1971, 207660000),
(1972, 209900000),
(1973, 211910000),
(1974, 213850000),
(1975, 215970000),
(1976, 218040000),
(1977, 220240000),
(1978, 222580000),
(1979, 225060000),
(1980, 227220000),
(1981, 229470000),
(1982, 231660000),
(1983, 233790000),
(1984, 235820000),
(1985, 237920000),
(1986, 240130000),
(1987, 242290000),
(1988, 244500000),
(1989, 246820000),
(1990, 249620000),
(1991, 252980000),
(1992, 256510000),
(1993, 259920000),
(1994, 263130000),
(1995, 266280000),
(1996, 269390000),
(1997, 272650000),
(1998, 275850000),
(1999, 279040000),
(2000, 282160000),
(2001, 284970000),
(2002, 287630000),
(2003, 290110000),
(2004, 292810000),
(2005, 295520000),
(2006, 298380000),
(2007, 301230000),
(2008, 304090000),
(2009, 306770000),
(2010, 308110000),
(2011, 310500000),
(2012, 312860000),
(2013, 315180000),
(2014, 317680000),
(2015, 320220000),
]

years = [d[0] for d in data]
populations = [d[1] for d in data]

# A formatter to display comma-separated numbers on the y axis.
def comma_func(y, pos):
	s = '{:0,d}'.format(int(y))
	return s

comma_format = ticker.FuncFormatter(comma_func)

# Make a bar graph.
x = numpy.arange(len(years)) + 0.25
width = 0.5
pyplot.figure(num=1, figsize=(7,4))
pyplot.plot(years, populations, color='b')
pyplot.title('U.S. Historical Population 1790-2015')
pyplot.ylabel('People')
pyplot.xlabel('Year')
pyplot.subplot(111).yaxis.set_major_formatter(comma_format)
pyplot.subplot(111).grid(b=True, axis='both')
pyplot.subplot(111).set_ylim([0, 350000000])
pyplot.subplot(111).set_xlim([1790, 2015])
pyplot.xticks(numpy.arange(1800, 2001, 20))
pyplot.savefig('U.S. Historical Population.svg', format='svg', bbox_inches='tight')
Licensing[edit]
I, the copyright holder of this work, hereby publish it under the following license:
| This file is made available under the Creative Commons CC0 1.0 Universal Public Domain Dedication. | |
| The person who associated a work with this deed has dedicated the work to the public domain by waiving all of their rights to the work worldwide under copyright law, including all related and neighboring rights, to the extent allowed by law. You can copy, modify, distribute and perform the work, even for commercial purposes, all without asking permission.
|
File history
Click on a date/time to view the file as it appeared at that time.
| Date/Time | Thumbnail | Dimensions | User | Comment | |
|---|---|---|---|---|---|
| current | 10:34, 4 March 2016 | | 626 × 365 (48 KB) | Douglaspperkins (talk | contribs) | User created page with UploadWizard |
You cannot overwrite this file.
File usage on Commons
There are no pages that use this file.
File usage on other wikis
The following other wikis use this file:
- Usage on uk.wikipedia.org