File:Vanadium-Produktion.svg
Jump to navigation
Jump to search

Size of this PNG preview of this SVG file: 529 × 396 pixels. Other resolutions: 320 × 240 pixels | 640 × 479 pixels | 1,024 × 767 pixels | 1,280 × 958 pixels | 2,560 × 1,916 pixels.
Original file (SVG file, nominally 529 × 396 pixels, file size: 11 KB)
Captions
Captions
Add a one-line explanation of what this file represents
Summary[edit]
| Description |
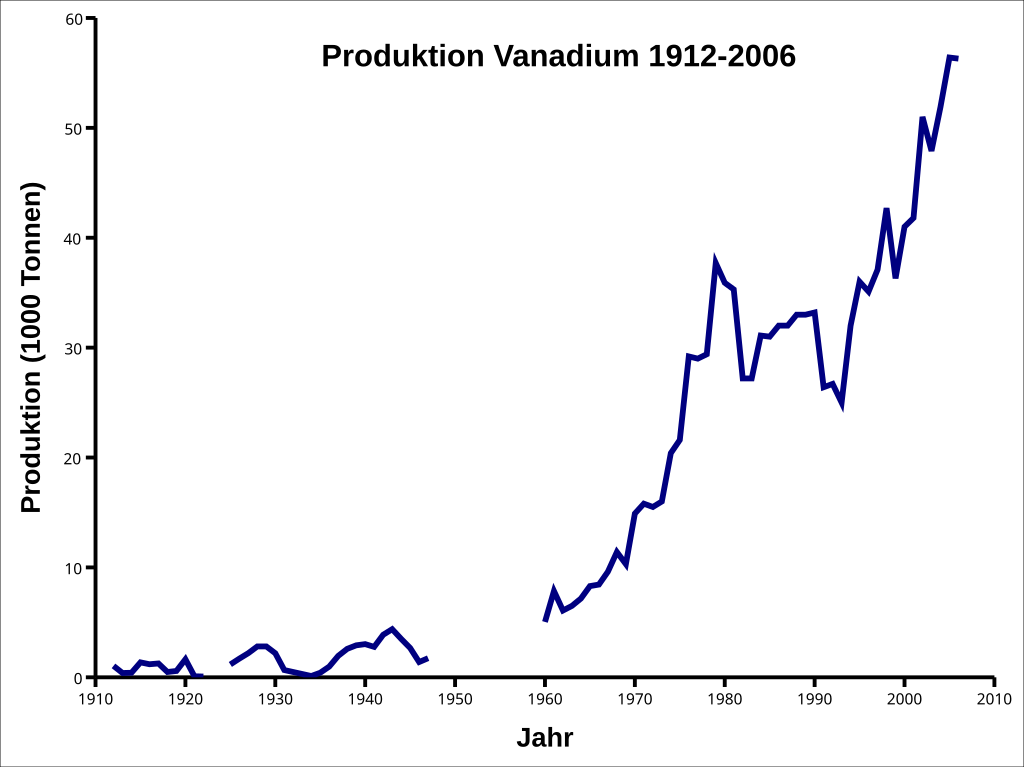
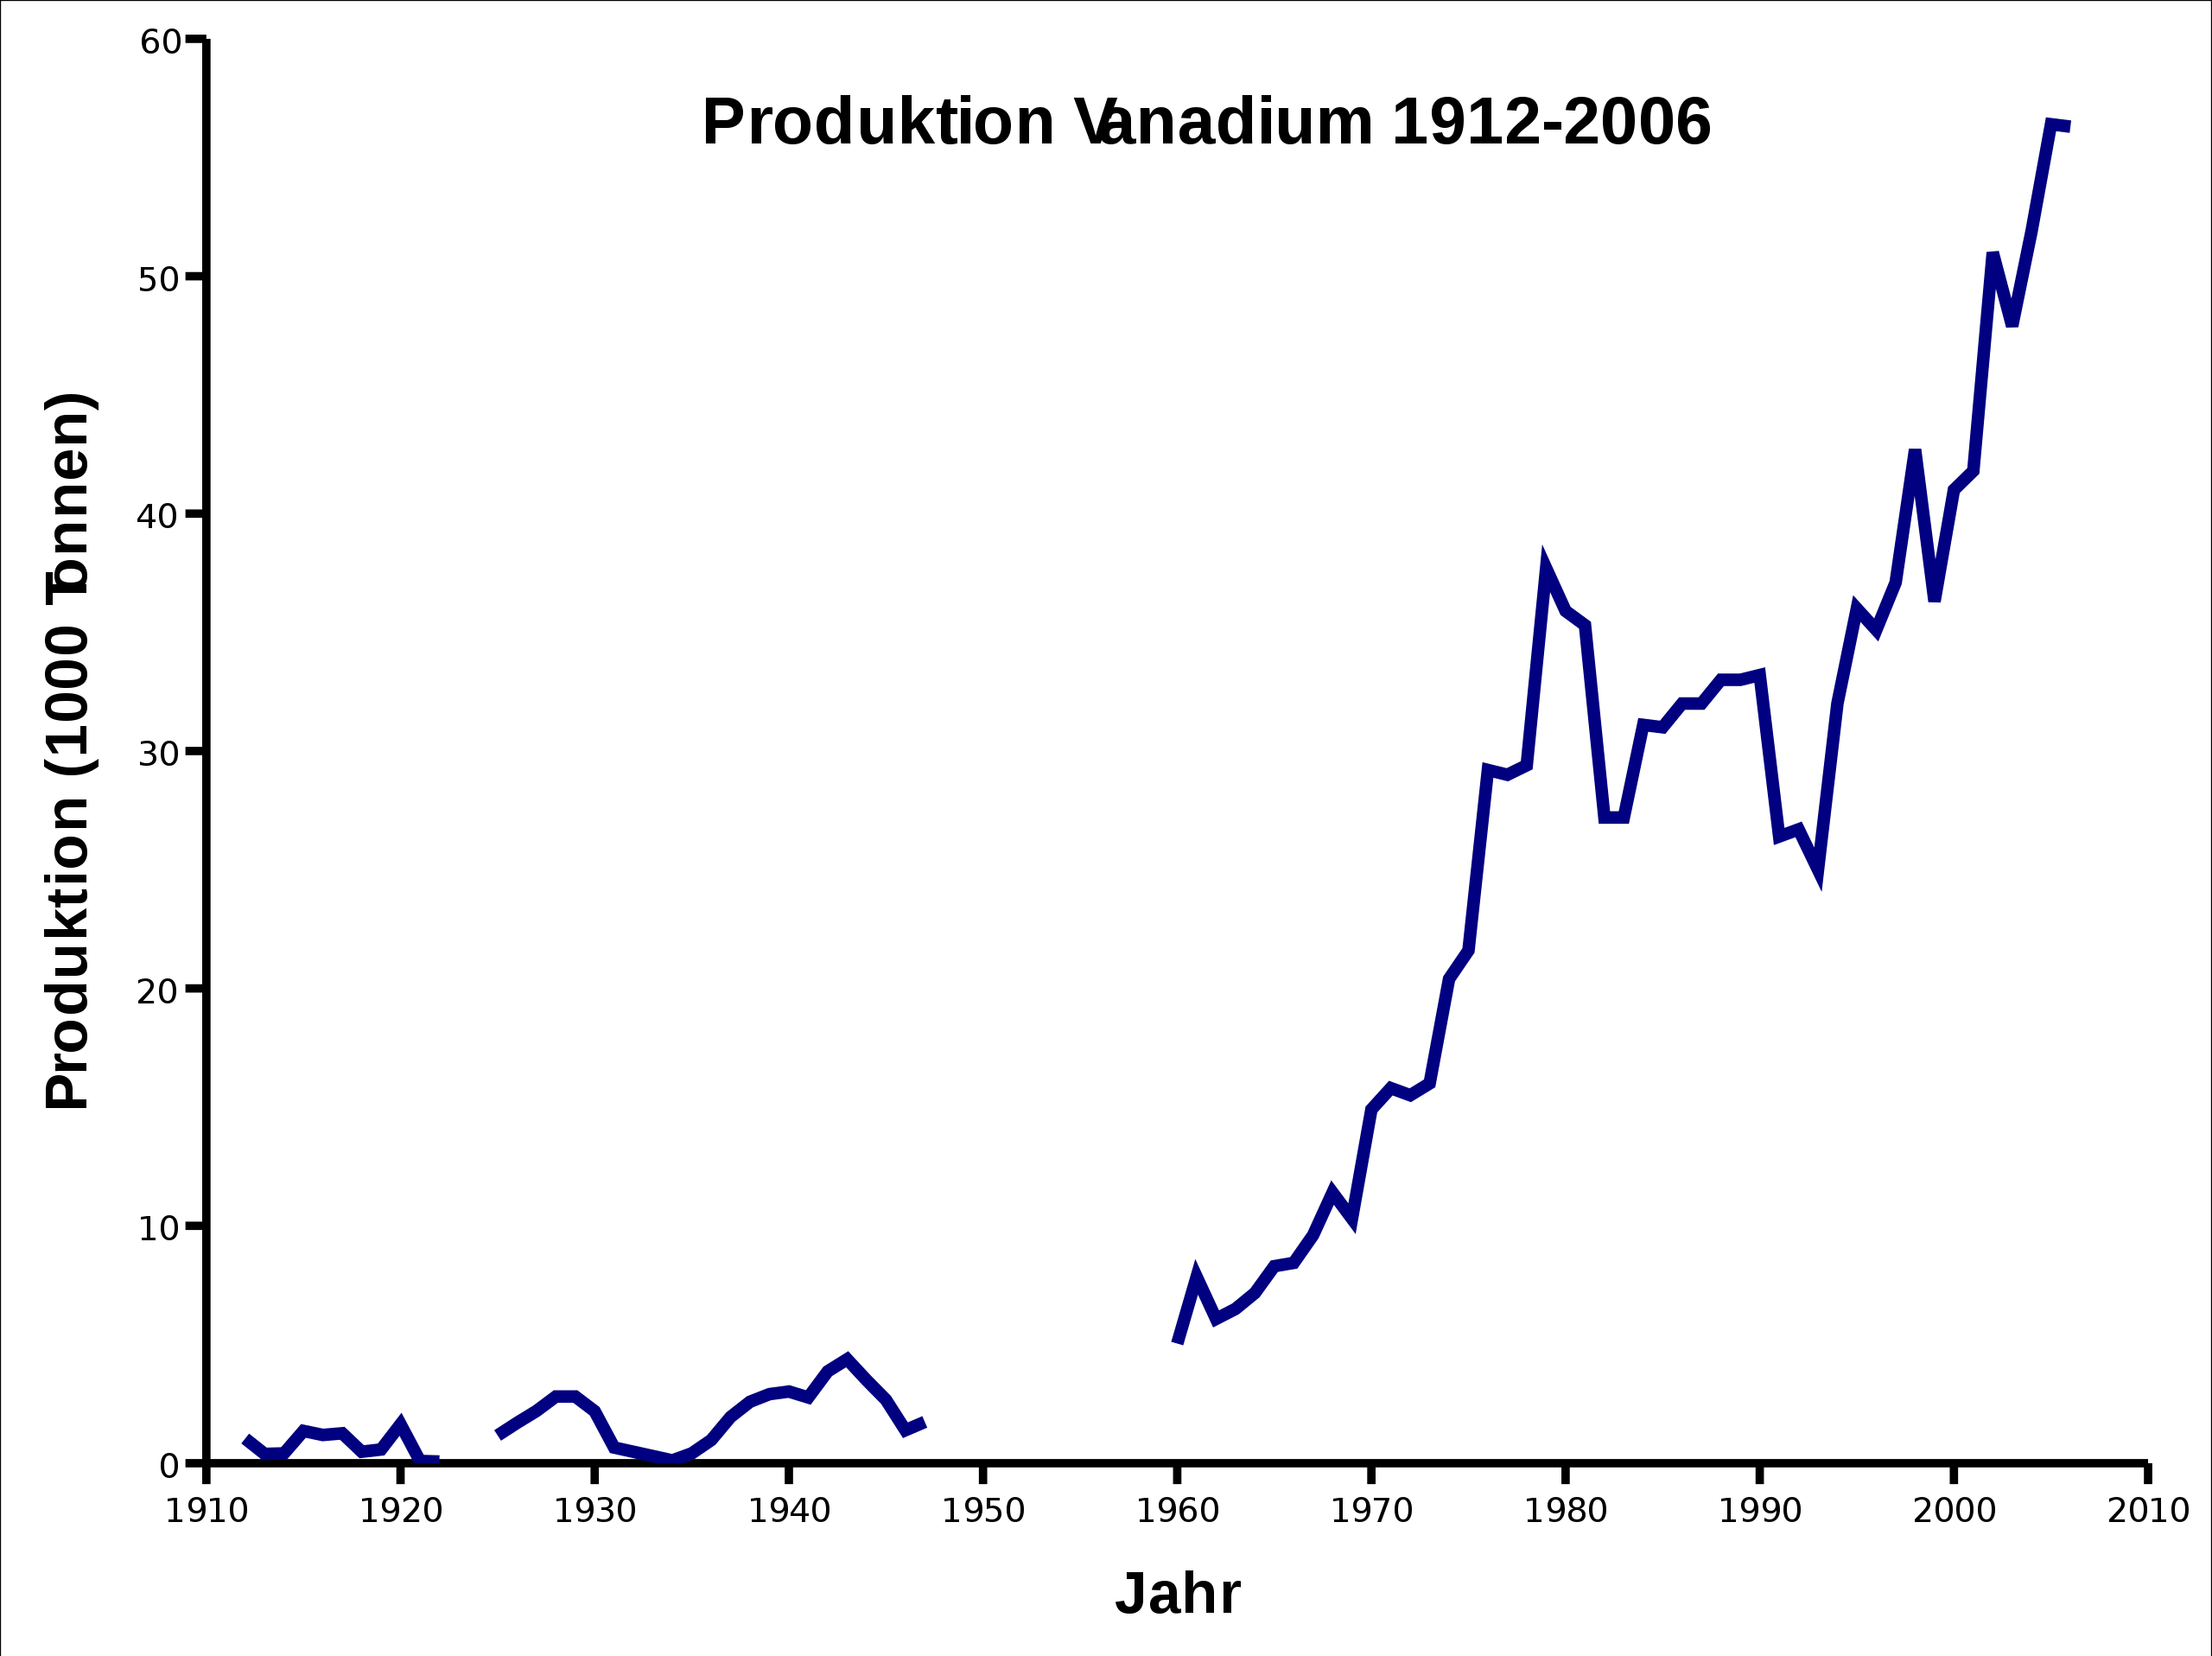
English: mine production of vanadium from 1912 to 2006
Deutsch: Vanadiumproduktion von 1912-2006 (deutsche Version) |
| Date | 5.10.2008 |
| Source | Eigenes Werk (own work), Daten von https://minerals.usgs.gov/minerals/pubs/historical-statistics |
| Author | Orci |
| Other versions |
.svg) |
Licensing[edit]
| I, the copyright holder of this work, release this work into the public domain. This applies worldwide. In some countries this may not be legally possible; if so: I grant anyone the right to use this work for any purpose, without any conditions, unless such conditions are required by law. |
Source[edit]
(To be used someday. As of 2019-02-09, the Template:SVG_Chart is buggy.)
{{SVG Chart
| Title        = Weltweite Produktion von Vanadium
| XAxisText    = Jahr
| YAxisText    = Produktion (in 1000 Tonnen)
| LegendType   = none

| XMin         = 1910
| XMax         = 2020
| XAxisValueStart = 1920
| XAxisValueStep = 20
| YMin         = 0
| YMax         = 90000
| Graph1Color = #666
| Graph2Color = #666
| Graph3Color = #666
| Graph1Values =
     1912	1.04
     1913	0.39
     1914	0.41
     1915	1.36
     1916	1.19
     1917	1.26
     1918	0.48
     1919	0.58
     1920	1.64
     1921	0.09
     1922	0.07
| Graph2Values =
     1925	1.17
     1926	1.70
     1927	2.20
     1928	2.81
     1929	2.81
     1930	2.19
     1931	0.66
     1932	0.48
     1933	0.30
     1934	0.12
     1935	0.42
     1936	0.98
     1937	1.95
     1938	2.59
     1939	2.91
     1940	3.02
     1941	2.77
     1942	3.87
     1943	4.38
     1944	3.50
     1945	2.67
     1946	1.39
     1947	1.74
| Graph3Values =
     1960	5.04
     1961	7.85
     1962	6.08
     1963	6.50
     1964	7.17
     1965	8.30
     1966	8.44
     1967	9.61
     1968	11.40
     1969	10.30
     1970	14.90
     1971	15.80
     1972	15.50
     1973	16.00
     1974	20.40
     1975	21.60
     1976	29.20
     1977	29.00
     1978	29.40
     1979	37.70
     1980	35.90
     1981	35.30
     1982	27.20
     1983	27.20
     1984	31.10
     1985	31.00
     1986	32.00
     1987	32.00
     1988	33.00
     1989	33.00
     1990	33.20
     1991	26.40
     1992	26.70
     1993	25.00
     1994	32.00
     1995	36.00
     1996	35.10
     1997	37.10
     1998	42.70
     1999	36.30
     2000	41.00
     2001	41.80
     2002	51.00
     2003	47.90
     2004	51.90
     2005	56.40
     2006	57.90
     2007	58.50
     2008	61.60
     2009	58.80
     2010	71.70
     2011	71.50
     2012	74.90
     2013	80.40
     2014	82.60
     2015	77.80
}}
File history
Click on a date/time to view the file as it appeared at that time.
| Date/Time | Thumbnail | Dimensions | User | Comment | |
|---|---|---|---|---|---|
| current | 15:41, 9 February 2019 | | 529 × 396 (11 KB) | RolandIllig (talk | contribs) | made background color of all text consistently transparent |
| 12:18, 6 October 2008 |  | 529 × 396 (12 KB) | Orci (talk | contribs) | {{Information |Description={{en|1=mine production of vanadium from 1912 to 2006}} {{de|1=Vanadiumproduktion von 1912-2006}} |Source=Eigenes Werk (own work), Daten aus http://minerals.usgs.gov/ds/2005/140/vanadium.pdf |Author=Orci |Date=5.10. |
You cannot overwrite this file.
File usage on Commons
The following 2 pages use this file:
File usage on other wikis
The following other wikis use this file: