File talk:Greenhouse-gas-emission-scenarios-01.png
plausible and likely emission scenario[edit]
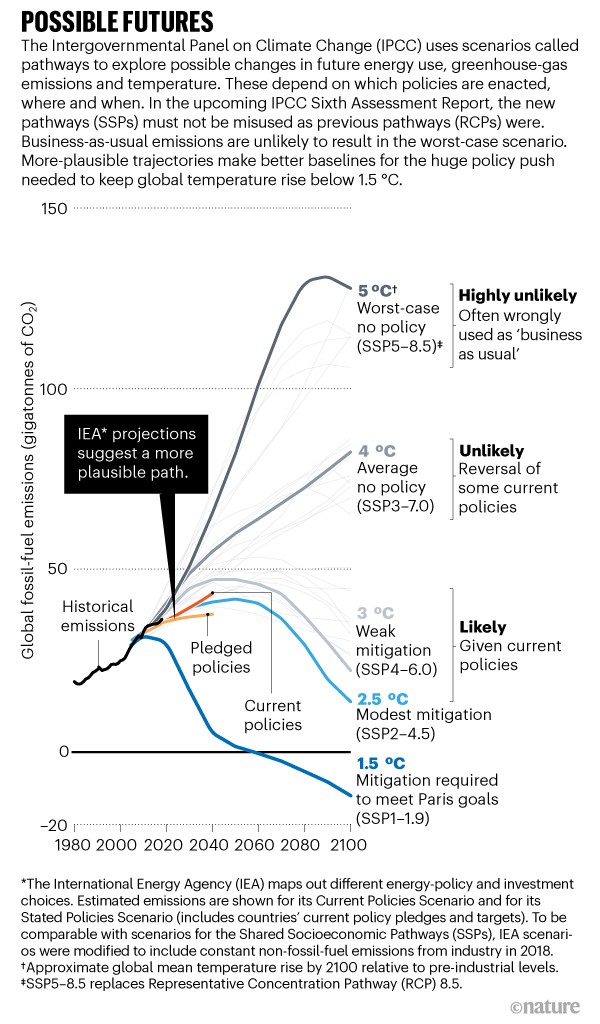
According to Hausfather and Peters, Nature 577, 618-620 (2020), the ‘business as usual’ story is misleading. Possible futures such as the 8.5 scenario with very high anthropogenic CO2 emissions are highly likely as a possible future, simply because there are not enough mineable fossil fuel reserves available. "Emission pathways to get to RCP8.5 generally require an unprecedented fivefold increase in coal use by the end of the century, an amount larger than some estimates of recoverable coal reserves", they write.
Therefore, the diagramm is not showing a plausible nor likely future in the pink-red spectrum labelled "no climate policies". These emission scenarios assume that the CO2e emissions keep rising until the endo of the century and double or even triple the yearly sum. Please have a look at what ressource specialists say how much non-renewable (= depleteable and finite) reserves are available: BGR Energy Study 2019, Table 4, page 41: ~40 000 EJ, 3500 Gt CO2. Whereas ressources are everything in the ground which has been discovered or is expected in a given area, reserves are thouse amounts which are mineable with current technology at current price. There is a debate how stable the reserve quantity is according to current prices: on the one hand higher market prices allow a relabelling from ressource to reserve, but on the other hand high energy prices result in a reduction of economic activities (such as after the two oil price shocks in the 70s) and ask for higher efficiency. With coal reserves, the classic definition is not used (= mineable at current prices) but geologist have a certain regarding depth and thickness of coal seams, e.g. everything up to 1200 m and thicker than 40 cm is expected to be mineable. This approach has lead to major reserve collapses in the last decades, as this approach has been shown to be too optimistic. See e.g. [1] which points out that British coal was estimated at ~200 Gt of reserves, of which today at the end of the full coal cycle only 30 Gt of hard coal have been mined. US coal reserves have fallen from 1923 to 2010 by a factor of more than 10 (from 3839 Gt to 237 Gt). German hard coal reserves collapsed in 2004, after policymakers made the decision to stop subsidizing coal mining. Mature coal mining areas had only 20%-40% of the estimated reserves actually mined, so with the coal approach there seems to be a bias for choosing the more optimistic numbers which overestimate the ultimately recoverable resource.
Coming back to the thesis of Hausfather and Peters, "RCP8.5 was intended to explore an unlikely high-risk future. But it has been widely used by some experts, policymakers and the media as something else entirely: as a likely ‘business as usual’ outcome. A sizeable portion of the literature on climate impacts refers to RCP8.5 as business as usual, implying that it is probable in the absence of stringent climate mitigation." & "We must all — from physical scientists and climate-impact modellers to communicators and policymakers — stop presenting the worst-case scenario as the most likely one." With 3400 Gt CO2 remaining as fossil fuel reserves (give or take a few hundred tons) the coming years will not see in the next 80 years an increase of FF based CO2 emissions. On the contrary, the no policy pathway (= no CO2 price) will probably be a bell-shaped curve anyway; peakers tell us the mid point of the fossil fuel age will be in this decade; coal use already peaked in 2013, conventional oil is in a plateau phase since 2005 (BGR Energy Study 2019, Figure 3-4: development of global production of liquid hydrocarbons, p. 44.
With the IPCC AR6 WGI SPM D.1.1 finding that there is a near-linear relationship between cumulative anthropogenic CO2 emissions and the global warming they cause of 0,45 °C per 1000 Gt CO2 as best estimate, the 3400 Gt from mineable fossil fuels in the ground accounts for 1,5 °C additional warming. Therefore the diagram should be relabelled with the yellow/orange span of possible scenarios as likely baseline, and the emission reduction policies are those below that target a maximum 2°C or 1,5°C global warming goal. See also en:Talk:Shared_Socioeconomic_Pathways#Likelihood_of_emission_scenarios. --Gunnar (talk) 12:42, 4 October 2021 (UTC)