Category:Diagrams
Jump to navigation
Jump to search
plan, drawing, sketch or outline to show how something works or the relationships between the parts of a whole  | |||||
| Upload media | |||||
| Subclass of | |||||
|---|---|---|---|---|---|
| Has use | |||||
| Different from | |||||
| Said to be the same as | chart | ||||
| |||||

English: Resources:
- Commons:Graphic Lab/Illustration workshop
- meta:Philip Greenspun illustration project/Requests - request creation/improvement of diagrams.
Subcategories
This category has the following 45 subcategories, out of 45 total.
!
- Featured diagrams (5 F)
- Gallery pages of diagrams (36 P)
*
- Diagram PDF files (34 F)
+
-
- Diagrams without usage (266 F)
?
A
B
C
D
- Diagram algebras (17 F)
- Diagrams about trusses (110 F)
I
J
K
- Kinship diagrams (34 F)
L
- Diagram legends (67 F)
M
- Mental maps (10 F)
- Misleading graphs (32 F)
P
- Perm Arrows (42 F)
- Problem trees (8 F)
Q
- Quick response code diagrams (257 F)
S
W
Pages in category "Diagrams"
The following 3 pages are in this category, out of 3 total.
Media in category "Diagrams"
The following 200 files are in this category, out of 3,902 total.
(previous page) (next page)-
-
-

-
-

-
 (Business life) Observation tool.png 5,021 × 3,857; 394 KB
-

-

-
 0015 - Leverage-Effekt-0..png 1,068 × 954; 38 KB
-
 050329-birthday1.png 463 × 271; 1 KB
-
 1 Conheça-os-grupos-do-INCOTERMS-e-suas-características.jpg 750 × 4,058; 511 KB
-
 100828 Hall interaction.png 720 × 540; 43 KB
-
 100902 Hall energy.jpg 720 × 540; 33 KB
-
 11308 html 6c89871foktaeder.jpg 570 × 773; 320 KB
-
 12 Phases of Research - FSNA.png 2,523 × 2,457; 446 KB
-
 12-12-G.gif 500 × 305; 13 KB
-
 123e453230.png 521 × 492; 43 KB
-
 123tiristor.PNG 775 × 341; 14 KB
-
 12943 2021 1311 Fig1 HTML.webp 1,944 × 2,150; 615 KB
-
 12943 2021 1311 Fig2 HTML.webp 1,944 × 705; 186 KB
-
 12943 2021 1311 Fig3 HTML.webp 1,418 × 1,412; 140 KB
-
 13238 2015 147 Fig1 HTML.webp 742 × 397; 52 KB
-
 160426 ImagePranav.jpg 651 × 498; 51 KB
-
 160426 ImagePranav2.jpg 647 × 507; 53 KB
-
 1839 William Grove Fuel Cell Chin.JPG 344 × 392; 23 KB
-
 1857 Earthquake fig. 104.png 420 × 218; 24 KB
-
 1857 Earthquake fig. 14.png 209 × 122; 12 KB
-
 1934-Thermionic-Tube-Chart.jpg 2,238 × 3,155; 1.12 MB
-
 1983 Perspective Territory Net.jpg 3,536 × 6,480; 2.91 MB
-
 1983 Xarxa TRAME.jpg 2,293 × 1,651; 914 KB
-
 1987 Xarxa TRAME a.jpg 2,305 × 1,636; 751 KB
-
 1db compression point.gif 372 × 237; 9 KB
-
 1db compression point.png 673 × 416; 25 KB
-
 1—screenshot-turbo51.com 2016-01-14 23-15-26.png 326 × 138; 17 KB
-
 2 dipoles diagram.jpg 611 × 224; 12 KB
-
 2 filament TIMS.png 584 × 360; 85 KB
-
 2 forskjellige ror; stevnror og sideror.jpg 1,115 × 409; 134 KB
-
 2 forskjellige ror; stevnror og sideror.tiff 12,300 × 4,093; 6.04 MB
-
 2 Half Adder.png 600 × 200; 9 KB
-
 2. Allergic response.tif 800 × 1,280; 879 KB
-
 2.68 Ga finalized ver 2-1.png 5,556 × 2,778; 728 KB
-
 20070101obecne schema.jpg 500 × 281; 13 KB
-
 20101230JA091 US report banner metrics minutely imp.png 2,600 × 1,400; 106 KB
-
 2015 Finland opinion polls.png 898 × 549; 62 KB
-
 201603 database.png 400 × 400; 16 KB
-
 201603 datarecord.png 400 × 400; 16 KB
-
 20200810AngermeENG.png 3,118 × 1,432; 516 KB
-
 20200810AngermeJPN.png 3,118 × 1,432; 514 KB
-
 2023 Grafik-Wikipedia Umsatzzahlen GEPA-bis-2021.jpg 3,508 × 2,480; 949 KB
-
 21graph.jpg 281 × 196; 12 KB
-
 29 CFR 1910.119 14 Elements of Process Safety Management.png 1,616 × 946; 53 KB
-
 2block2.gif 560 × 270; 5 KB
-
 2blockchaingraph.png 491 × 212; 28 KB
-
 2D Normally Distributed Points.png 600 × 400; 27 KB
-
 2nd order delta-sigma modulation loop.svg 535 × 108; 23 KB
-
-
-
-
 2—screenshot-turbo51.com 2016-01-14 23-16-01.png 296 × 151; 14 KB
-
 3 force 1.tiff 249 × 310; 82 KB
-
 3 force diagram sagittal.tiff 277 × 392; 117 KB
-
 3 force diagram.tiff 594 × 285; 206 KB
-
 3 force Transverse.tiff 317 × 384; 133 KB
-
 3 node Directed graph.png 600 × 529; 36 KB
-
 3-phase sys with 20% 3rd Harmonic.png 1,590 × 728; 53 KB
-
 31899 AdityaMohan.png 1,350 × 914; 62 KB
-
 332nd Air Expeditionary Wing Unit Device for Organizational Flag.jpg 6,852 × 4,452; 1.79 MB
-
 3D 복강경 시스템.jpg 3,074 × 820; 744 KB
-
 3ind.png 436 × 232; 25 KB
-
 3month-lapse-structure.png 488 × 385; 27 KB
-
 3VehiclePerformanceMetrics.png 1,920 × 911; 127 KB
-
 3—screenshot-turbo51.com 2016-01-14 23-16-37.png 316 × 162; 16 KB
-
 4 procesy správy produktových informací.png 908 × 271; 44 KB
-
 4n=2.png 491 × 349; 11 KB
-
 4n=3.png 495 × 343; 11 KB
-
 4n=4.png 495 × 328; 10 KB
-
 4To2 Encoder.jpg 600 × 210; 11 KB
-
 4—screenshot-turbo51.com 2016-01-14 23-17-22.png 297 × 156; 17 KB
-
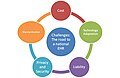 5 challenges.jpg 926 × 605; 32 KB
-
 5 Local Galactic Group (blank 2).png 2,953 × 2,953; 177 KB
-
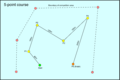 5-point course.png 1,200 × 801; 73 KB
-
 54-fz-schema.png 670 × 380; 40 KB
-
 5HT2C pathway.png 780 × 481; 84 KB
-
 5—screenshot-turbo51.com 2016-01-14 23-17-44.png 292 × 112; 11 KB
-
 5—screenshot-turbo51.com 2016-01-14 23-18-02.png 279 × 157; 17 KB
-
 6 dof.JPG 761 × 364; 33 KB
-
 6 Virgo Supercluster (blank 2).png 2,953 × 2,953; 378 KB
-
 6-11 Framework scheme for 3DClass.png 1,833 × 2,278; 255 KB
-
 7 Local Superclusters (blank 2).png 2,953 × 2,953; 1.37 MB
-
 77Class77.png 819 × 580; 65 KB
-
 802.11 Frame Control.png 792 × 97; 5 KB
-
 A bc.png 571 × 211; 8 KB
-
 A fragment of the HMM lattice showing two possible paths.png 1,212 × 814; 100 KB
-

-
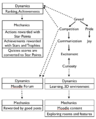
 A look at a game program's structure.png 966 × 428; 25 KB
-
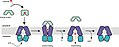
 A model for lens repression..jpg 600 × 399; 70 KB
-
 A model of endoderm patterning by Wnt and FGF..jpg 432 × 185; 28 KB
-

-
 A sDiagramm.png 732 × 998; 32 KB
-
-
 A visual representation of the "who owns my data" session at -wef.jpg 2,272 × 1,705; 930 KB
-
-
 A-C..jpg 600 × 546; 126 KB
-
 A-E..jpg 600 × 176; 58 KB
-
 A.R.H..jpg 875 × 596; 76 KB
-
 A13.png 393 × 323; 31 KB
-
 A2219 radio CLEAN.png 1,957 × 2,261; 91 KB
-
 A2219 radio DIRTY.png 1,957 × 1,957; 119 KB
-
 A2219 radio RESOLVE.png 1,957 × 2,261; 82 KB
-
 Aaa1.png 289 × 135; 4 KB
-
 Aaa3.png 234 × 126; 2 KB
-
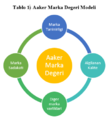 Aaker Marka Değeri Modeli.png 385 × 424; 19 KB
-
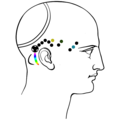 AB head side.png 600 × 600; 1.37 MB
-
 Abbildung 11.jpg 1,040 × 720; 138 KB
-
 Abbildung 22.jpg 1,040 × 720; 133 KB
-
 Abbildung 44.jpg 1,040 × 720; 161 KB
-
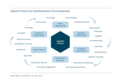 Abbildung Cognitive Finance als interdisziplinärer Forschungsansatz2.png 1,386 × 941; 80 KB
-
 Abbildung Gartenzaunchiffre.png 1,066 × 375; 8 KB
-
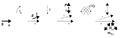 Abbildung.wm.pdf 2,400 × 750; 47 KB
-
 ABC importer.jpg 800 × 314; 29 KB
-
 Abelhas - Filogenia 2013.png 907 × 626; 122 KB
-
 Abildung 1.1.jpg 1,040 × 720; 106 KB
-
 Ablauf der Wertschätzungs-Ausstellung.gif 900 × 300; 27 KB
-
 Ablauf einer Lernphase.png 1,280 × 720; 152 KB
-
 Ablauf einer Phase im Agilen Lernen.png 1,280 × 720; 411 KB
-
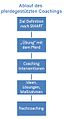 Ablauf pferdegestütztes Coaching k.jpg 346 × 623; 82 KB
-
 Ablaufdiagramm.png 244 × 439; 6 KB
-
 AblegenEindampfenAchterspring.tif 1,936 × 1,605; 252 KB
-
 AblegenEindampfenSeitenleine Enddrehung.tif 4,434 × 2,314; 391 KB
-
 AblegenEindampfenSeitenleine Momente.tif 2,415 × 2,043; 237 KB
-
 AblegenEindampfenSeitenleine Zugwinkel.tif 1,915 × 2,564; 285 KB
-
 AblegenEindampfenVorspring Aproj.tif 1,166 × 1,397; 115 KB
-
 AblegenEindampfenVorspring Belegpunkte.tif 2,298 × 1,480; 226 KB
-
 Absatz CD-LP 1984-2018.png 580 × 409; 16 KB
-
 Absatz CD-LP 1984-2021.png 848 × 590; 38 KB
-
 Absatz CD-LP.png 534 × 448; 17 KB
-
 Absolute advantage.jpg 895 × 284; 16 KB
-
 Abstrahierung mit Hilfe von geogebra I.png 335 × 815; 23 KB
-
 Abstrahierung mit Hilfe von Geogebra II.png 263 × 700; 25 KB
-
 Abu Keynes 1.png 856 × 542; 39 KB
-
 Abu new classical.png 799 × 548; 42 KB
-
 AC-TZs.jpg 568 × 271; 132 KB
-
 Accelerazione centripeta e tangenziale.png 468 × 307; 18 KB
-
 Accelerazione in rapporto al grafico spazio tempo.png 474 × 142; 9 KB
-
 Accelerazione istantanea e velocità.png 350 × 400; 14 KB
-
 Accelerazione media.png 350 × 300; 8 KB
-
 Accessible Housing for Wheelchair Users.jpg 1,500 × 1,781; 564 KB
-
 Accumulatore addizionatore-sottrattore.png 655 × 399; 12 KB
-
 Accumulazione di carica in un dielettrico.jpg 762 × 676; 88 KB
-
 Acquise Procedure SDSC-BW simplified 2019-11.png 3,910 × 1,172; 213 KB
-
 Acteurs-prospective (3594912536).jpg 670 × 768; 99 KB
-
 Acteurs-prospective (3595199134).jpg 761 × 852; 119 KB
-
 Acteurs-prospective-regionale (3594106167).jpg 871 × 798; 164 KB
-
 Active non-apoptotic protease.png 1,446 × 398; 76 KB
-
 Active systems.jpg 799 × 565; 146 KB
-
 Activiti.PNG 711 × 286; 11 KB
-
 ActivityandRfASuccess.png 959 × 656; 26 KB
-
 Activité.jpg 344 × 464; 39 KB
-
 Actual and Predicted Mileage of Cable Cars.jpg 702 × 468; 57 KB
-
 Actualización de inventario FF.png 845 × 246; 23 KB
-
 Adapting and Writing Language Lessons Diagram P322.png 872 × 477; 42 KB
-
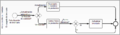
 Adaptive Noise Cancelling Configuration.png 602 × 301; 35 KB
-
 Addieren-in-den-natuerlichen-Zahlen-v2.svg 257 × 103; 51 KB
-
 Addieren-von-natürliches-Zahlen-v2.svg 270 × 99; 46 KB
-
 Adding a Caption flow diagram.png 944 × 1,108; 82 KB
-
 Addition algoritm 4.png 943 × 2,518; 126 KB
-
 Additive and Dominance Effects.png 1,255 × 1,273; 28 KB
-
 Addizionatore in serie.png 282 × 207; 3 KB
-
 Addizione con i Numeri Relativi.jpg 607 × 258; 28 KB
-
 Addizione.png 255 × 129; 2 KB
-
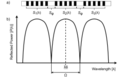 Addressed fiber Bragg structure.png 8,080 × 5,200; 1.15 MB
-
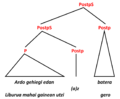
 Aditz 01.png 667 × 250; 60 KB
-
 Aditz 02.png 678 × 320; 54 KB
-
 Aditz laguntzailea 01.png 1,509 × 609; 308 KB
-
 Aditz laguntzailea 02.png 1,528 × 738; 382 KB
-
 Aditz laguntzailea 03.png 1,494 × 616; 377 KB
-
 Aditz laguntzailea 04.png 1,512 × 732; 422 KB
-
 Aditz laguntzailea 05.png 1,496 × 732; 363 KB
-
 Aditz laguntzailea 06.png 1,506 × 730; 280 KB
-
 Aditz laguntzailea 07.png 1,494 × 732; 336 KB
-
 Aditz laguntzailea 08.png 1,506 × 735; 394 KB
-
 Aditz laguntzailea 09.png 1,496 × 721; 345 KB
-
 Aditz laguntzailea 10.png 1,494 × 717; 393 KB
-
 Aditz-izena 1.png 987 × 1,072; 31 KB
-
 Aditz-izena 2.png 1,012 × 1,159; 40 KB
-
 Aditz-partizipioa -EZ GERO.png 1,154 × 955; 44 KB
-
 Aditza1.png 1,556 × 723; 66 KB
-
 Aditza2.png 1,378 × 1,026; 37 KB
-
 Aditza3.png 1,832 × 912; 37 KB
-
 AdjacencyMatrixGraphBLAS.png 594 × 280; 21 KB
-
 AdjacencyMatrixGraphBLASBFS.png 745 × 280; 26 KB
-
 Administrative divisions of North Korea, diagram.jpg 1,511 × 675; 228 KB
-
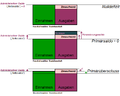 Administrativer Saldo, Primärsaldo, Nulldefizit.png 820 × 655; 32 KB
-
 Adventures in physiology... Wellcome L0022410.jpg 1,908 × 972; 85 KB
-

-
 Affinity-column.jpg 500 × 950; 69 KB
-
 Afroasiatic 6-Family Diagram.svg 1,420 × 960; 6 KB
-
 Afroasiatic progression.jpg 798 × 511; 89 KB
-
 AFSF Schema P5 Conférence à Saigon - 1958.png 1,200 × 874; 88 KB
-
 AfterSW.jpg 700 × 622; 86 KB
.jpg)
.jpg)

.jpg)
.jpg)
_Observation_tool.png)
.jpg)


,_impressed_on_the_shoulder_of_the_Prophet_Muhammad,_Persia,_16th_-_early_17th_Century.jpg)


.jpg)
.jpg)
.jpg)


.png)
.png)
.png)