File:Averages (%) of foods containing appropriate levels of positive nutrients (to achieve adequate intake of any positive nutrient) based on the proposed method in food groups.pdf

From Wikimedia Commons, the free media repository
Jump to navigation Jump to search

Original file(4,964 × 7,020 pixels, file size: 389 KB, MIME type: application/pdf)

Captions

Captions

Add a one-line explanation of what this file represents

Summary[edit]

Description
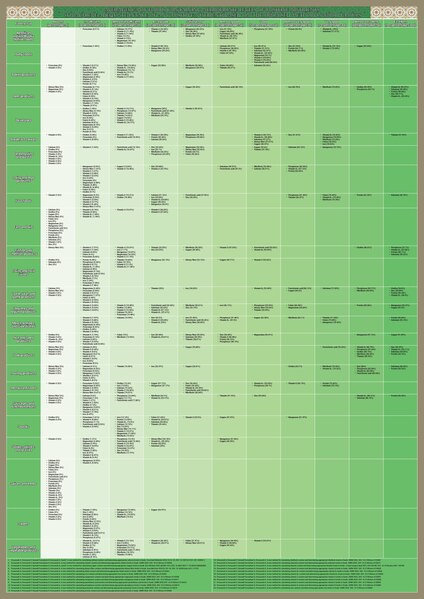
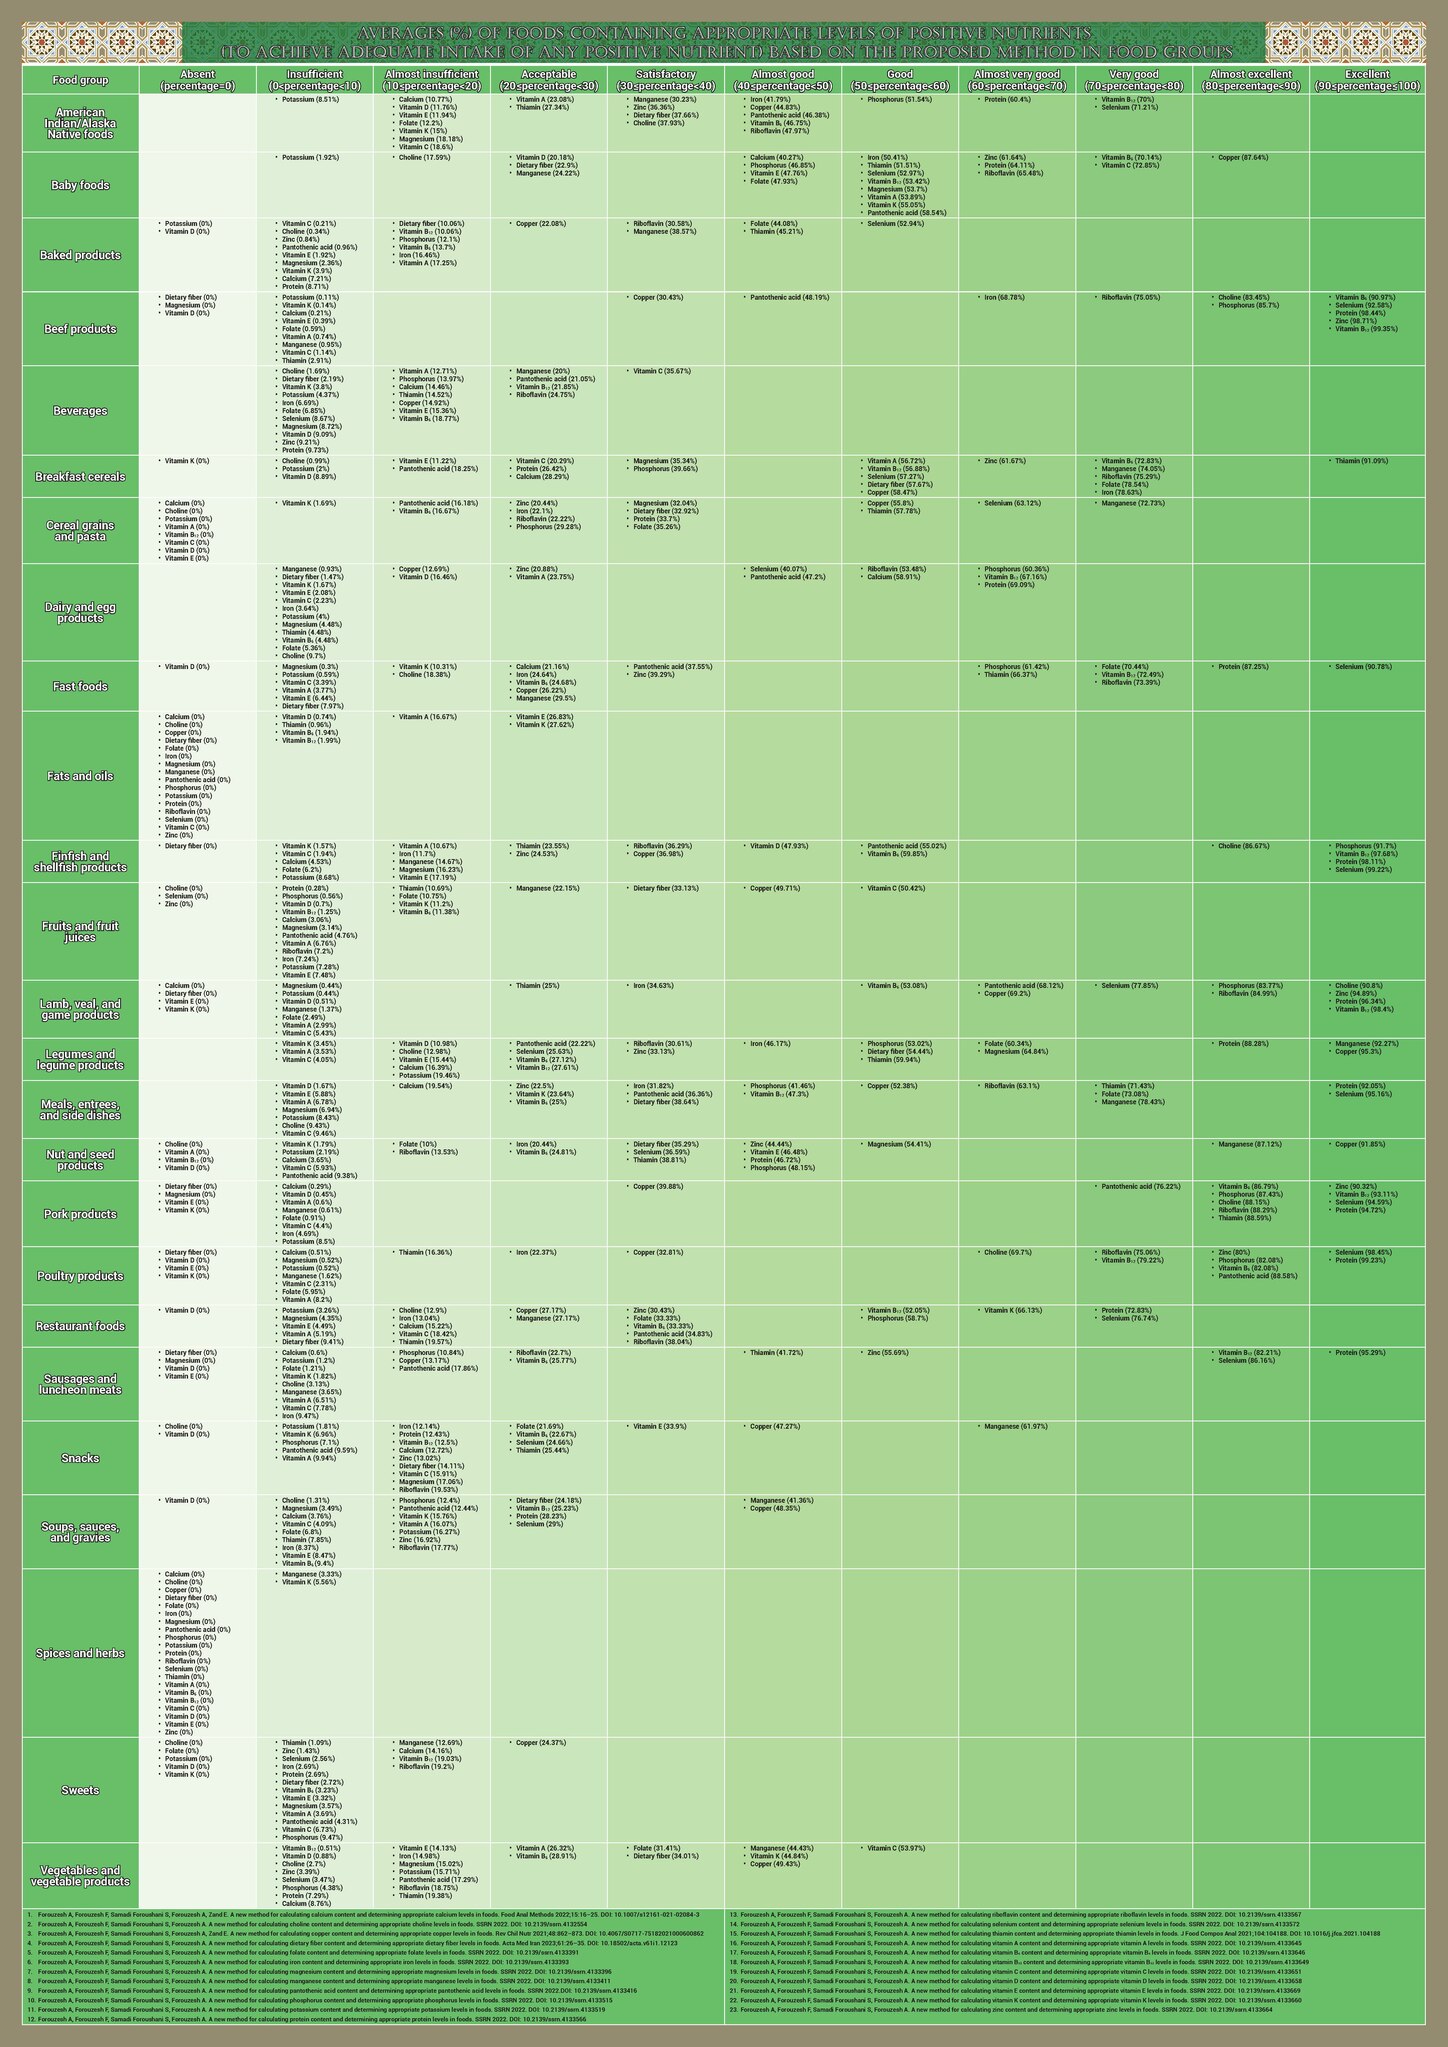
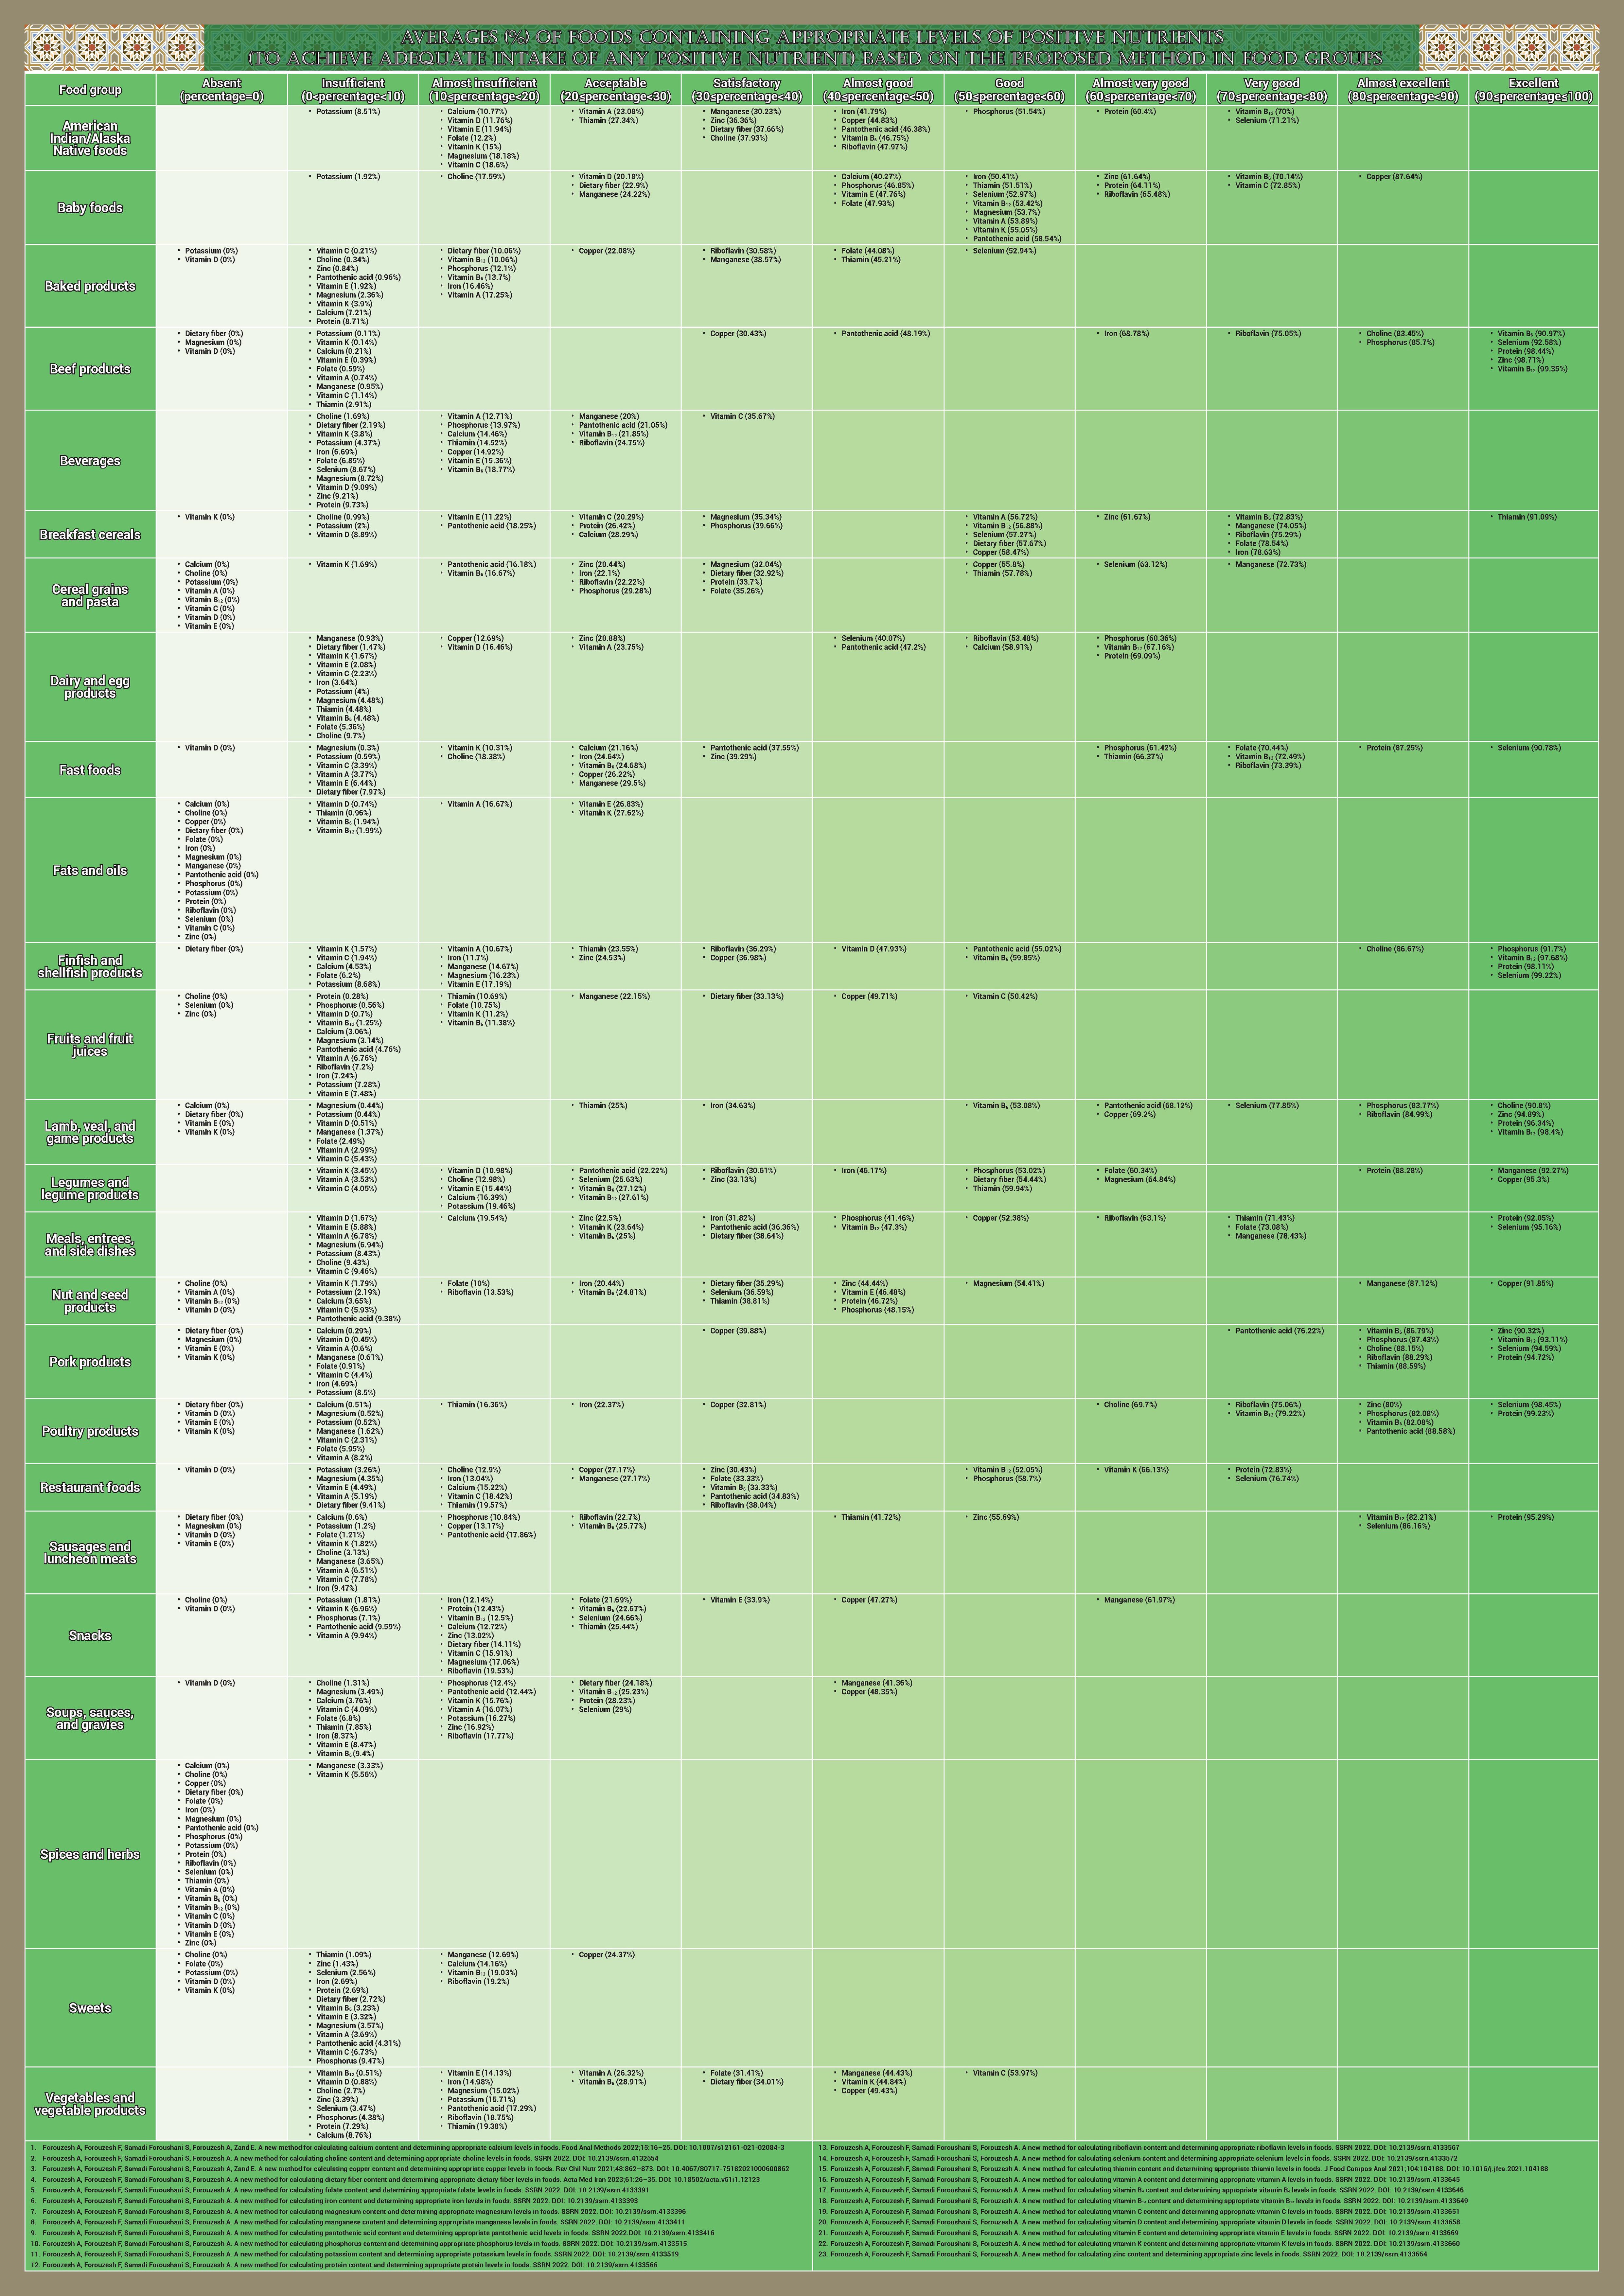
English: About 96.5% of foods contained calcium. On the basis of the proposed method, the average (%) of foods containing appropriate calcium levels in food groups was 11.38%, of which 8.39% was the average of calcium source (good source of calcium) foods, and 2.99% was the average of high-calcium (excellent source of calcium) foods.

About 96.5% of foods contained choline. On the basis of the proposed method, the average (%) of foods containing appropriate choline levels in food groups was 21.91%, of which 19.35% was the average of choline source (good source of choline) foods, and 2.56% was the average of high choline (excellent source of choline) foods.
About 97% of foods contained copper. On the basis of the proposed method, the average (%) of foods containing appropriate copper levels in food groups was 41.24%, of which 23.92% was the average of copper source (good source of copper) foods, and 17.32% was the average of high copper (excellent source of copper) foods.
About 58% of foods contained dietary fiber. On the basis of the proposed method, the average (%) of foods containing appropriate dietary fiber levels in food groups was 16.75%, of which 11.85% was the average of dietary fiber source (good source of dietary fiber) foods, and 4.9% was the average of high dietary fiber (excellent source of dietary fiber) foods.
About 91% of foods contained folate (also known as folacin, folic acid, and vitamin B9). On the basis of the proposed method, the average (%) of foods containing appropriate folate levels in food groups was 22.62%, of which 11.23% was the average of folate source (good source of folate) foods, and 11.39% was the average of high folate (excellent source of folate) foods.
About 96.8% of foods contained iron. On the basis of the proposed method, the average (%) of foods containing appropriate iron levels in food groups was 22.12%, of which 13.69% was the average of iron source (good source of iron) foods, and 8.43% was the average of high iron (excellent source of iron) foods.
About 97.2% of foods contained magnesium. On the basis of the proposed method, the average (%) of foods containing appropriate magnesium levels in food groups was 13.81%, of which 10.7% was the average of magnesium source (good source of magnesium) foods, and 3.11% was the average of high magnesium (excellent source of magnesium) foods.
About 97.8% of foods contained manganese. On the basis of the proposed method, the average (%) of foods containing appropriate manganese levels in food groups was 31.37%, of which 15.08% was the average of manganese source (good source of manganese) foods, and 16.29% was the average of high manganese (excellent source of manganese) foods.
About 96.2% of foods contained pantothenic acid (also known as pantothenate and vitamin B5). On the basis of the proposed method, the average (%) of foods containing appropriate pantothenic acid levels in food groups was 30.05%, of which 21.85% was the average of pantothenic acid source (good source of pantothenic acid) foods, and 8.2% was the average of high pantothenic acid (excellent source of pantothenic acid) foods.
About 97.2% of foods contained phosphorus. On the basis of the proposed method, the average (%) of foods containing appropriate phosphorus levels in food groups was 39.68%, of which 33.53% was the average of phosphorus source (good source of phosphorus) foods, and 6.15% was the average of high phosphorus (excellent source of phosphorus) foods.
About 98.2% of foods contained potassium. On the basis of the proposed method, the average (%) of foods containing appropriate potassium levels in food groups was 4.61%, of which 4.43% was the average of potassium source (good source of potassium) foods, and 0.18% was the average of high potassium (excellent source of potassium) foods.
About 95.9% of foods contained protein. On the basis of the proposed method, the average (%) of foods containing appropriate protein levels in food groups was 51.69%, of which 22.68% was the average of protein source (good source of protein) foods, and 29.01% was the average of high protein (excellent source of protein) foods.
About 95.9% of foods contained riboflavin (also known as vitamin B2). On the basis of the proposed method, the average (%) of foods containing appropriate riboflavin levels in food groups was 40.13%, of which 23.58% was the average of riboflavin source (good source of riboflavin) foods, and 16.55% was the average of high riboflavin (excellent source of riboflavin) foods.
About 94.5% of foods contained selenium. On the basis of the proposed method, the average (%) of foods containing appropriate selenium levels in food groups was 51.19%, of which 16.87% was the average of selenium source (good source of selenium) foods, and 34.32% was the average of high selenium (excellent source of selenium) foods.
About 95.6 % of foods contained thiamin (also known as vitamin B1 and aneurin)). On the basis of the proposed method, the average (%) of foods containing appropriate thiamin levels in food groups was 32.46 %, of which 17.54 % was the average of thiamin source (good source of thiamin) foods, and 14.92 % was the average of high thiamin (excellent source of thiamin) foods.
About 65.6% of foods contained vitamin A. On the basis of the proposed method, the average (%) of foods containing appropriate vitamin A levels in food groups was 12.63%, of which 5.05% was the average of vitamin A source (good source of vitamin A) foods, and 7.58% was the average of high vitamin A (excellent source of vitamin A) foods.
About 95.2% of foods contained vitamin B6 (pyridoxine and related compounds). On the basis of the proposed method, the average (%) of foods containing appropriate vitamin B6 levels in food groups was 34.17%, of which 17.85% was the average of vitamin B6 source (good source of vitamin B6) foods, and 16.32% was the average of high vitamin B6 (excellent source of vitamin B6) foods.
About 61.3% of foods contained vitamin B12 (also known as cobalamin). On the basis of the proposed method, the average (%) of foods containing appropriate vitamin B12 levels in food groups was 43.57%, of which 9.05% was the average of vitamin B12 source (good source of vitamin B12) foods, and 34.52% was the average of high vitamin B12 (excellent source of vitamin B12) foods.
About 48.7% of foods contained vitamin C (also known as L-ascorbic acid). On the basis of the proposed method, the average (%) of foods containing appropriate vitamin C levels in food groups was 13.81%, of which 4.53% was the average of vitamin C source (good source of vitamin C) foods, and 9.28% was the average of high vitamin C (excellent source of vitamin C) foods.
About 37.1% of foods contained vitamin D (also known as calciferol). On the basis of the proposed method, the average (%) of foods containing appropriate vitamin D levels in food groups was 5.21%, of which 2.86% was the average of vitamin D source (good source of vitamin D) foods, and 2.35% was the average of high vitamin D (excellent source of vitamin D) foods.
About 92% of foods contained vitamin E. On the basis of the proposed method, the average (%) of foods containing appropriate vitamin E levels in food groups was 11.23%, of which 6.46% was the average of vitamin E source (good source of vitamin E) foods, and 4.77% was the average of high vitamin E (excellent source of vitamin E) foods.
About 79.2% of foods contained vitamin K. On the basis of the proposed method, the average (%) of foods containing appropriate vitamin K levels in food groups was 12.08%, of which 5.98% was the average of vitamin K source (good source of vitamin K) foods, and 6.1% was the average of high vitamin K (excellent source of vitamin K) foods.

About 97.5% of foods contained zinc. On the basis of the proposed method, the average (%) of foods containing appropriate zinc levels in food groups was 34.39%, of which 17.63% was the average of zinc source (good source of zinc) foods, and 16.76% was the average of high zinc (excellent source of zinc) foods.
Date
Source Own work
Author SSamadi15

Licensing[edit]

I, the copyright holder of this work, hereby publish it under the following license:
w:en:Creative Commons
attribution share alike
This file is licensed under the Creative Commons Attribution-Share Alike 4.0 International license.
You are free:
  • to share – to copy, distribute and transmit the work
  • to remix – to adapt the work
Under the following conditions:
  • attribution – You must give appropriate credit, provide a link to the license, and indicate if changes were made. You may do so in any reasonable manner, but not in any way that suggests the licensor endorses you or your use.
  • share alike – If you remix, transform, or build upon the material, you must distribute your contributions under the same or compatible license as the original.

File history

Click on a date/time to view the file as it appeared at that time.

Date/TimeThumbnailDimensionsUserComment
current14:21, 2 November 2023Thumbnail for version as of 14:21, 2 November 20234,964 × 7,020 (389 KB)SSamadi15 (talk | contribs)Uploaded own work with UploadWizard

There are no pages that use this file.

Metadata