File:Averages (%) of foods containing appropriate vitamin B12 levels (to achieve adequate vitamin B12 intake) based on the proposed method in food groups.pdf

Original file (1,752 × 1,239 pixels, file size: 348 KB, MIME type: application/pdf)
Captions
Captions
Summary[edit]
| Description |
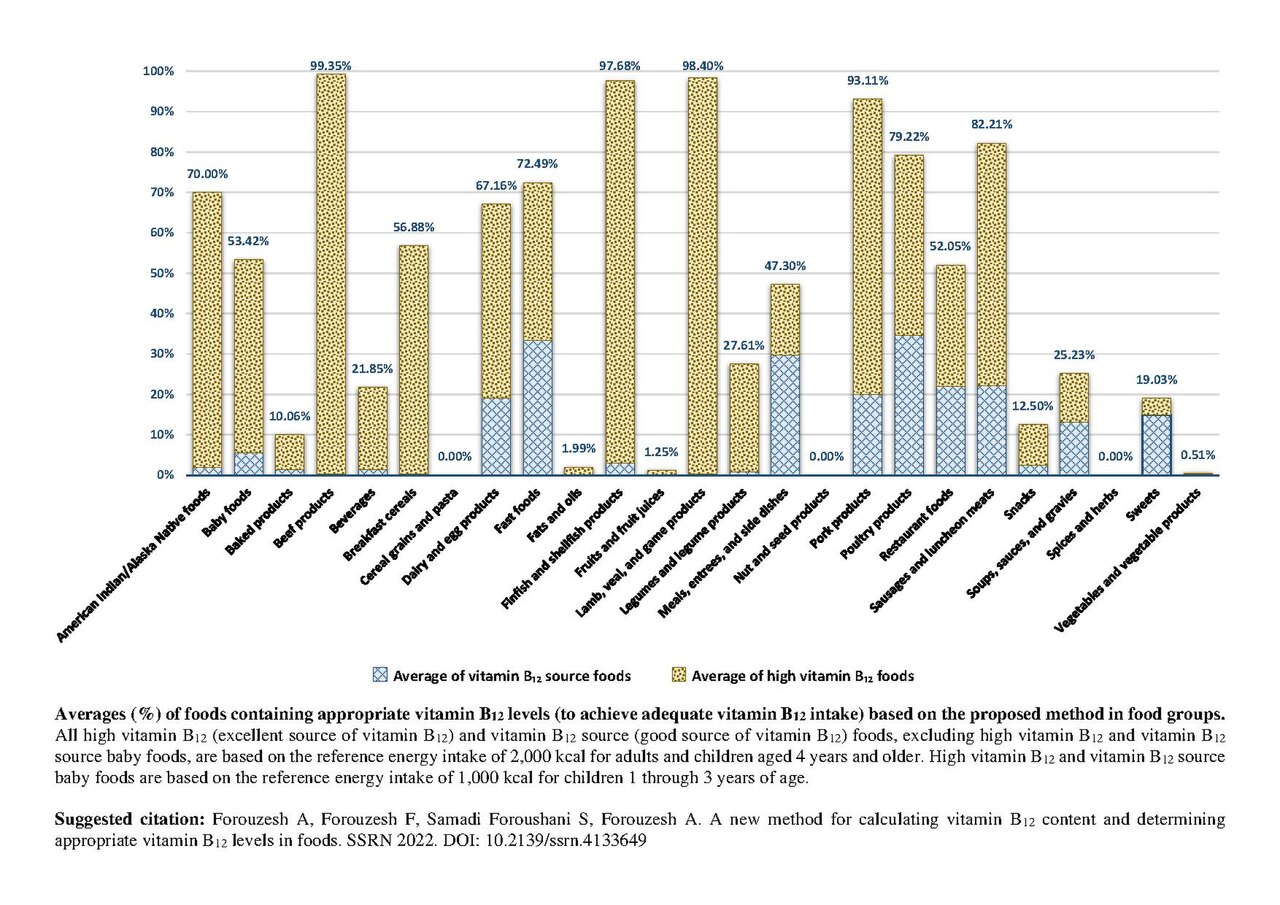
English: Averages (%) of foods containing appropriate vitamin B12 levels (to achieve adequate vitamin B12 intake) based on the proposed method in food groups. All high vitamin B12 (excellent source of vitamin B12) and vitamin B12 source (good source of vitamin B12) foods, excluding high vitamin B12 and vitamin B12 source baby foods, are based on the reference energy intake of 2,000 kcal for adults and children aged 4 years and older. High vitamin B12 and vitamin B12 source baby foods are based on the reference energy intake of 1,000 kcal for children 1 through 3 years of age. About 61.3% of foods contained vitamin B12 (also known as cobalamin). On the basis of the proposed method, the average (%) of foods containing appropriate vitamin B12 levels in food groups was 43.57%, of which 9.05% was the average of vitamin B12 source (good source of vitamin B12) foods, and 34.52% was the average of high vitamin B12 (excellent source of vitamin B12) foods. Beef products with 99.35%, lamb, veal, and game products with 98.4%, finfish and shellfish products with 97.68%, pork products with 93.11%, sausages and luncheon meats with 82.21%, poultry products with 79.22%, fast foods with 72.49%, American Indian/Alaska Native foods with 70%, dairy and egg products with 67.16%, breakfast cereals with 56.88%, baby foods with 53.42%, restaurant foods with 52.05%, and meals, entrees, and side dishes with 47.3% had the highest averages of foods containing appropriate vitamin B12 levels. Foods containing appropriate vitamin B12 levels were not found in three food groups (cereal grains and pasta; nut and seed products; spices and herbs) and were very few in three food groups (fats and oils; fruits and fruit juices; vegetables and vegetable products). |
| Date | |
| Source | Own work |
| Author | SSamadi15 |
Licensing[edit]
- You are free:
- to share – to copy, distribute and transmit the work
- to remix – to adapt the work
- Under the following conditions:
- attribution – You must give appropriate credit, provide a link to the license, and indicate if changes were made. You may do so in any reasonable manner, but not in any way that suggests the licensor endorses you or your use.
- share alike – If you remix, transform, or build upon the material, you must distribute your contributions under the same or compatible license as the original.
File history
Click on a date/time to view the file as it appeared at that time.
| Date/Time | Thumbnail | Dimensions | User | Comment | |
|---|---|---|---|---|---|
| current | 14:31, 25 October 2023 |  | 1,752 × 1,239 (348 KB) | SSamadi15 (talk | contribs) | Uploaded own work with UploadWizard |
You cannot overwrite this file.
File usage on Commons
There are no pages that use this file.