File:Aves A model based on local cell behaviours explains the global movements in the epiblast and experimental conditions.jpg
Jump to navigation
Jump to search

Size of this preview: 750 × 600 pixels. Other resolutions: 300 × 240 pixels | 601 × 480 pixels | 961 × 768 pixels | 1,280 × 1,023 pixels | 1,500 × 1,199 pixels.
Original file (1,500 × 1,199 pixels, file size: 501 KB, MIME type: image/jpeg)
Captions
Captions
Add a one-line explanation of what this file represents
Summary[edit]
| Description |
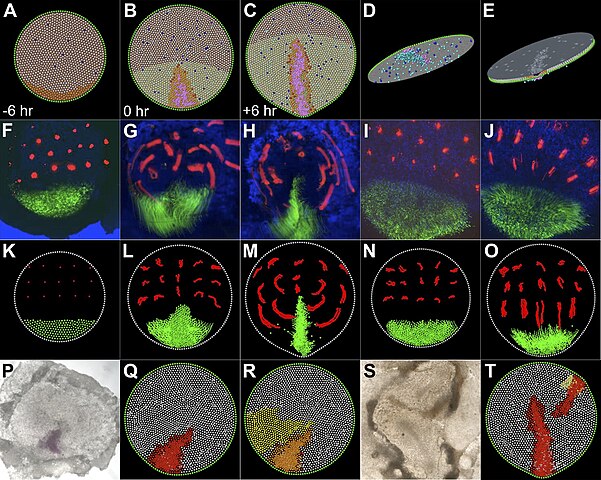
Fig 7. A model based on local cell behaviours explains the global movements in the epiblast and experimental conditions. |
| Date | |
| Source | https://elifesciences.org/articles/1817#fig6s1 https://doi.org/10.7554/eLife.01817 Local cell interactions and self-amplifying individual cell ingression drive amniote gastrulation eLife 3:e01817. |
| Author | Octavian Voiculescu Lawrence Bodenstein I-Jun Lau Claudio D Stern |

|
This file, which was originally posted to an external website, has not yet been reviewed by an administrator or reviewer to confirm that the above license is valid. See Category:License review needed for further instructions.
|
Licensing[edit]
This file is licensed under the Creative Commons Attribution 3.0 Unported license.
- You are free:
- to share – to copy, distribute and transmit the work
- to remix – to adapt the work
- Under the following conditions:
- attribution – You must give appropriate credit, provide a link to the license, and indicate if changes were made. You may do so in any reasonable manner, but not in any way that suggests the licensor endorses you or your use.
Copyright
© 2014, Voiculescu et al.
This article is distributed under the terms of the Creative Commons Attribution License, which permits unrestricted use and redistribution provided that the original author and source are credited.
File history
Click on a date/time to view the file as it appeared at that time.
| Date/Time | Thumbnail | Dimensions | User | Comment | |
|---|---|---|---|---|---|
| current | 21:12, 16 April 2024 | | 1,500 × 1,199 (501 KB) | Rasbak (talk | contribs) | {{Information |description=Fig 7. A model based on local cell behaviours explains the global movements in the epiblast and experimental conditions.<br> (A–E) Epithelial intercalation in a posterior domain (orange) and EMT (blue, isolated events, cooperative in the pink domain) are sufficient to explain the formation of the PS. (A–C) sequence in time, vertical view; (D) ventral view of the epiblast; (E) apical view of the epiblast. (F–H) Sequence from a time-lapse experiment, with cells in the... |
You cannot overwrite this file.
File usage on Commons
There are no pages that use this file.