File:US timeline. Deaths involving other synthetic opioids, predominately Fentanyl.jpg
Jump to navigation
Jump to search

Size of this preview: 800 × 586 pixels. Other resolutions: 320 × 234 pixels | 640 × 469 pixels | 815 × 597 pixels.
Original file (815 × 597 pixels, file size: 96 KB, MIME type: image/jpeg)
Captions
Captions
Add a one-line explanation of what this file represents

|
This chart image could be re-created using vector graphics as an SVG file. This has several advantages; see Commons:Media for cleanup for more information. If an SVG form of this image is available, please upload it and afterwards replace this template with
{{vector version available|new image name}}.
It is recommended to name the SVG file “US timeline. Deaths involving other synthetic opioids, predominately Fentanyl.svg”—then the template Vector version available (or Vva) does not need the new image name parameter. |


Summary
[edit]
| Description |
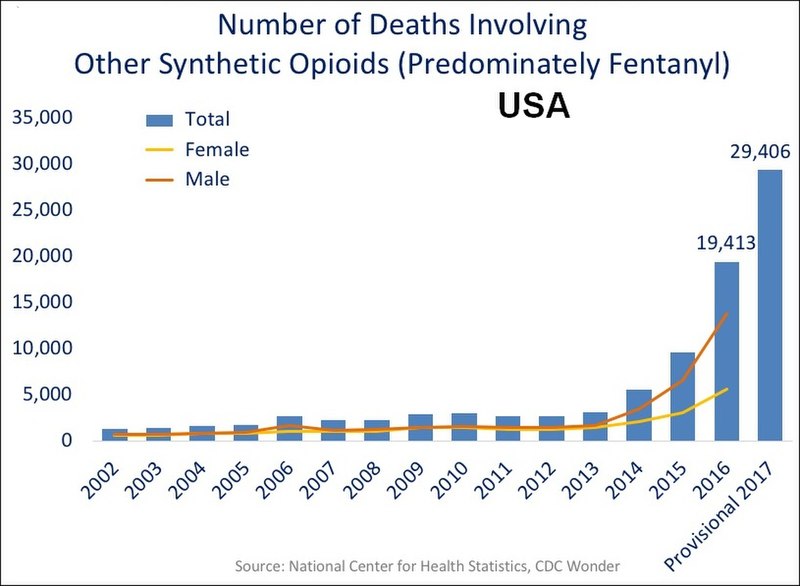
English: "National Overdose Deaths—Number of Deaths Involving Other Synthetic Opioids (Predominately Fentanyl). The figure above is a bar chart showing the total number of U.S. overdose deaths involving other synthetic opioids from 2002 to 2016 and provisional 2017 data. Other synthetic opioids is a category dominated by illicit fentanyl. The chart is overlayed by a line graph showing the number of deaths of females and males. From 2002 to 2017 there was a 22-fold increase in the total number of deaths." |
| Date | - date of first upload to the Commons. See file history for dates of later uploads. |
| Source | 2002-2017 chart. From Overdose Death Rates. By National Institute on Drug Abuse (NIDA). |
| Author | National Institute on Drug Abuse (NIDA). And User:Timeshifter. I (Timeshifter) cropped the original chart, and added "USA" to it. Freeware IrfanView was used. I put the adapted chart under the same public domain license. See Commons:Convert tables and charts to wiki code or image files, and the section about adding text to chart images. |
Licensing
[edit]
This image is a work of the National Institutes of Health, part of the United States Department of Health and Human Services, taken or made as part of an employee's official duties. As a work of the U.S. federal government, the image is in the public domain.
 |
||
| This file has been identified as being free of known restrictions under copyright law, including all related and neighboring rights. | ||
File history
Click on a date/time to view the file as it appeared at that time.
| Date/Time | Thumbnail | Dimensions | User | Comment | |
|---|---|---|---|---|---|
| current | 19:01, 6 September 2018 | | 815 × 597 (96 KB) | Timeshifter (talk | contribs) | User created page with UploadWizard |
You cannot overwrite this file.
File usage on Commons
There are no pages that use this file.
File usage on other wikis
The following other wikis use this file:
- Usage on ar.wikipedia.org
- Usage on en.wikipedia.org
- Usage on es.wikipedia.org
- Usage on gl.wikipedia.org
- Usage on hy.wikipedia.org
- Usage on pt.wikipedia.org
- Usage on zh.wikipedia.org