Category:2009 swine flu outbreak graphs
Jump to navigation
Jump to search
Media in category "2009 swine flu outbreak graphs"
The following 33 files are in this category, out of 33 total.
-
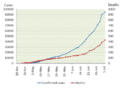
 2009 vs 2020 pandemic comparison.png 862 × 522; 25 KB
-

-
 Cas de A H1N1 par ages.gif 447 × 354; 7 KB
-
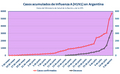 Casos de Gripe A (H1N1) en Argentina (acumulado 2009).PNG 897 × 556; 48 KB
-
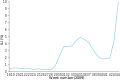
 Casos de gripe A (H1N1) en Argentina por semana.png 892 × 518; 45 KB
-
 CDC MMWR M8d0430a2f.png 641 × 306; 17 KB
-

-
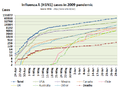
 H1N1 charts with greek labels.png 740 × 835; 41 KB
-
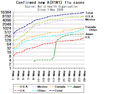
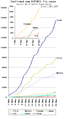
 H1N1 countries, cases and fatalities chart.png 739 × 863; 37 KB
-
 H1N1 ILI Surveillance Norway 2009.svg 600 × 400; 13 KB
-
 H1N1 Norway graph.PNG 789 × 425; 13 KB
-
 H1N1 until May 27 greek labels.png 741 × 771; 31 KB
-
 H1N1 virus infection in Mexico 2009-05-06.gif 641 × 320; 18 KB
-
 H1n1graph.gif 1,107 × 508; 8 KB
-
 Hong Kong H1N1 cumulative frequency.png 1,307 × 571; 33 KB
-
 Influenza-2009-cases 01.png 1,137 × 736; 145 KB
-
 Influenza-2009-cases-hans.png 1,032 × 786; 50 KB
-
 Influenza-2009-cases-logarithmic-01.png 1,306 × 839; 253 KB
-
 Influenza-2009-cases-logarithmic-2.png 779 × 531; 73 KB
-
 Influenza-2009-cases-logarithmic-hans.png 720 × 530; 82 KB
-
 Influenza-2009-cases-logarithmic.png 720 × 530; 78 KB
-
 Influenza-2009-cases.png 1,032 × 786; 50 KB
-
 Influenza-2009-new-A(H1N1)-WHO-log.PNG 600 × 470; 19 KB
-
 Influenza-2009-new-A(H1N1)-WHO.PNG 512 × 896; 24 KB
-
 IPD40.GIF 960 × 720; 22 KB
-
 IPD45.GIF 960 × 720; 18 KB
-
 Muestras por Municipio.jpg 2,815 × 1,375; 469 KB
-
 OECD comparison.png 715 × 412; 50 KB
-
 Swineflu uk consultations.svg 505 × 472; 22 KB
-
 Swineflu uk hpa model.svg 655 × 478; 61 KB
-
 Swineflu uk rate.png 728 × 534; 37 KB
-
 Swineflu uk rate.svg 637 × 475; 89 KB
-
 Trend for A(H1N1) in the Philippines.png 696 × 314; 12 KB

_virus_patients_in_the_Philippines_(8_June_2009).png)

_en_Argentina_(acumulado_2009).PNG)
_en_Argentina_por_semana.png)

_cases_in_Taiwan.jpg)


-WHO-log.PNG)
-WHO.PNG)


_in_the_Philippines.png)