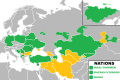
Category:2020 maps of Asia
Jump to navigation
Jump to search
Temperate regions: North America · South America · Africa · Europe · Asia · Oceania – Polar regions: – Other regions:
English: 2020 maps of Asia
Español: Mapas de Asia en 2020
Subcategories
This category has the following 7 subcategories, out of 7 total.
B
- 2020 maps of Bangladesh (6 F)
C
- 2020 maps of Cambodia (5 F)
- 2020 maps of China (14 F)
G
- 2020 maps of Georgia (1 F)
I
- 2020 maps of India (10 F)
L
- 2020 maps of Lebanon (2 F)
R
- 2020 maps of Russia (6 F)
Media in category "2020 maps of Asia"
The following 8 files are in this category, out of 8 total.
-
 COVID-19 location in Surabaya.png 2,009 × 1,132; 928 KB
-
 ECDM 20200113 Iran-Afghanistan-Pakistan.pdf 1,625 × 1,125; 864 KB
-
 ECDM 20200430 Iran-Afghanistan.pdf 1,625 × 1,125; 873 KB
-
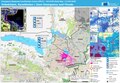 ECDM 20200512 Uzbekistan-Kazakhstan.pdf 1,625 × 1,125; 733 KB
-
 ECDM 20200907 East Asia TC HAISHEN.pdf 1,625 × 1,125; 661 KB
-
 ECDM 20201103 TC GONI.pdf 1,625 × 1,125; 624 KB
-
 Türkvizyon 2020 map.svg 1,000 × 665; 768 KB
-
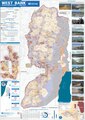 West Bank Access Restrictions June 2020.pdf 4,964 × 7,020; 15.18 MB

