Category:Agricultural statistics of the world
Jump to navigation
Jump to search
Media in category "Agricultural statistics of the world"
The following 64 files are in this category, out of 64 total.
-
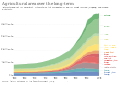 Agricultural area over the long-term, OWID.svg 850 × 600; 31 KB
-
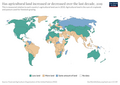
 Agricultural area per capita, OWID.svg 850 × 600; 25 KB
-
 Agricultural export subsidies, OWID.svg 850 × 600; 9 KB
-
 Agricultural land use per person, OWID.svg 850 × 600; 15 KB
-
 Agricultural water withdrawals vs. GDP per capita, OWID.svg 850 × 600; 13 KB
-
 Agricultural yields in key crops per hectare, 1961-2014, OWID.svg 850 × 600; 31 KB
-
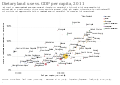
 Agriculture value added per worker vs. GDP per capita, OWID.svg 850 × 600; 181 KB
-
 Agriculture-land-fao (OWID 0020).png 850 × 600; 38 KB
-
 Agriculture-more-less-land (OWID 0019).png 850 × 600; 103 KB
-
 Biofuel production by region, OWID.svg 850 × 600; 37 KB
-

-
 Cereal crop yield vs. fertilizer application, OWID.svg 850 × 600; 37 KB
-
 Cereal distribution to food, animal feed and other uses, OWID.svg 850 × 600; 14 KB
-
 Cereal production, yield and land use, OWID.svg 850 × 600; 15 KB
-
 Cereal yield vs. GDP per capita, OWID.svg 850 × 600; 41 KB
-
 Cereal yields vs. GDP per capita, OWID.svg 850 × 600; 40 KB
-
 Cereal yields vs. tractor inputs in agriculture, OWID.svg 850 × 600; 202 KB
-
 Cereals allocated to food, animal feed and fuel, World.png 3,400 × 2,400; 316 KB
-
 Change-calories-climate-yield (OWID 0166).png 850 × 600; 107 KB
-
 Climatic impacts by year after different nuclear war soot injections.webp 1,889 × 1,938; 320 KB
-
 Composition of national gross domestic product by sector, OWID.svg 850 × 600; 16 KB
-
 Cropland per capita, OWID.svg 850 × 600; 15 KB
-
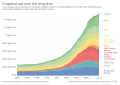 Cropland use over the long-term, OWID.svg 850 × 600; 32 KB
-
 Decline-of-the-worlds-wild-mammals.png 2,615 × 1,924; 269 KB
-
 Dietary land use vs. beef consumption, OWID.svg 850 × 600; 34 KB
-
 Dietary land use vs. GDP per capita, OWID.svg 850 × 600; 34 KB
-
 Employment in agriculture vs GDP per capita, OWID.svg 850 × 600; 42 KB
-
 Employment in agriculture vs. urban population, OWID.svg 850 × 600; 44 KB
-
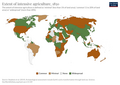 Extent-of-intensive-agriculture (OWID 0331).png 850 × 600; 104 KB
-
 FAO projections of arable land to 2050, OWID.svg 850 × 600; 8 KB
-
 GDP per head vs share of agriculture in employment, OWID.svg 850 × 600; 61 KB
-
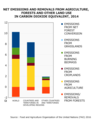 GHG from AFOLU.png 729 × 938; 49 KB
-
 Global agricultural land use by major crop type, OWID.svg 850 × 600; 13 KB
-
 Global average human diet and protein composition and usage of crop-based products.webp 2,117 × 1,598; 176 KB
-
 Global food miles by transport method, OWID.svg 850 × 600; 5 KB
-
 Global freshwater use over the long-run, OWID.svg 850 × 600; 8 KB
-
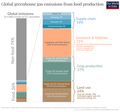 Global greenhouse gas emissions from food production.png 1,624 × 1,520; 155 KB
-

-
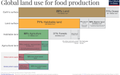 Global-land-use-graphic.png 6,251 × 3,951; 560 KB
-
 Greenhouse gas emissions from agriculture, OWID.svg 850 × 600; 10 KB
-
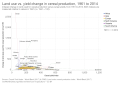 Land use vs. yield change in cereal production, OWID.svg 850 × 600; 103 KB
-
 Land-use-agriculture-longterm (OWID 0589).png 850 × 600; 45 KB
-
 Land-use-for-vegetable-oil-crops (OWID 0588).png 850 × 600; 76 KB
-
 Long-term-change-in-land-use.png 3,214 × 2,900; 501 KB
-
 Nitrous oxide emissions from agriculture, OWID.svg 850 × 600; 19 KB
-
 Nitrous-oxide-agriculture (OWID 0620).png 850 × 600; 102 KB
-
 Number of people employed in agriculture since 1800, OWID.svg 850 × 600; 15 KB
-
 Onset-year-intensive-agriculture (OWID 0700).png 850 × 600; 97 KB
-

-
 Projections for global peak agricultural land, OWID.svg 850 × 600; 12 KB
-
 Regulation-illegal-fishing (OWID 0869).png 850 × 600; 108 KB
-
 Share of agriculture in GDP vs GDP per capita, 1, OWID.svg 850 × 600; 68 KB
-
 Share of agriculture in GDP vs GDP per capita, OWID.svg 850 × 600; 42 KB
-

-

-
 Share of global fish stocks that are not overexploited, OWID.svg 850 × 600; 5 KB
-
 Share of global food miles by transport method, OWID.svg 850 × 600; 5 KB
-
 Share of male vs female employment in agriculture, OWID.svg 850 × 600; 37 KB
-
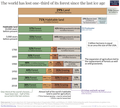
 Share-cereals-animal-feed (OWID 0943).png 850 × 600; 107 KB
-
 Tea production by region, OWID.svg 850 × 600; 26 KB
-

-
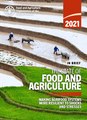 The State of Food and Agriculture 2021. Making agrifood systems more resilient to shocks and stresses, In brief.pdf 943 × 1,297, 28 pages; 1.46 MB
-
 Évolution de la surface agricole à long terme, OWID.svg 850 × 600; 30 KB
-
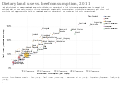
 所得国別牛の頭数.png 1,000 × 867; 159 KB


.png)
.png)


.png)


.png)


.png)
.png)


.png)

.png)


.png)


.png)


