Category:Data flow diagrams
Jump to navigation
Jump to search
English: A data flow diagram (DFD) is a graphical representation of the flow of data through an information system. It differs from the system flowchart as it shows the flow of data through processes instead of hardware.
graphical representation of the "flow" of data through an information system | |||||
| Upload media | |||||
| Instance of |
| ||||
|---|---|---|---|---|---|
| Subclass of | |||||
| |||||
Subcategories
This category has the following 2 subcategories, out of 2 total.
G
- Graphics pipeline (29 F)
P
- Pipeline (software) (15 F)
Pages in category "Data flow diagrams"
This category contains only the following page.
Media in category "Data flow diagrams"
The following 86 files are in this category, out of 86 total.
-
 DiagramaRiesgoTI.png 699 × 422; 29 KB
-
 Flujo de datos ESB Fraude.png 912 × 557; 50 KB
-
 FlujoInfo.png 913 × 664; 55 KB
-
 A2 3 Three schema approach.svg 577 × 407; 8 KB
-
 Adult Criminal Justice System.png 688 × 478; 27 KB
-
 Architecture et circulation des flux en phase 1.jpg 864 × 553; 112 KB
-
 Arrowright.svg 80 × 29; 193 bytes
-
 Backup-DFD.png 755 × 509; 37 KB
-
 Bron64654654654654.JPG 84 × 64; 1 KB
-
 Chord project.png 979 × 404; 45 KB
-
 Chord project.svg 973 × 378; 21 KB
-
 COB BUCKET FLOW CHART.jpg 819 × 1,058; 111 KB
-
 Codificador uvlc.png 720 × 540; 58 KB
-
 Conditiondataflow.png 355 × 526; 17 KB
-
 Core Audio Synthesis.jpg 288 × 175; 31 KB
-
 Data Flow Diagram Example.jpg 1,169 × 640; 95 KB
-
 Data flow diagram with Spanish labels.jpg 576 × 720; 66 KB
-
 Data Integration (KAFKA) (Case 3).png 1,952 × 1,402; 349 KB
-
 Data Intense Analysis (Case2) Tele-Communication Companies merging.png 1,792 × 1,244; 276 KB
-
 Data Parameter.png 222 × 218; 10 KB
-
 Data-flow-diagram-example.svg 478 × 77; 7 KB
-
 Data-flow-diagram-notation-es.svg 220 × 320; 8 KB
-
 Data-flow-diagram-notation.svg 220 × 320; 8 KB
-
 Data-flow1.jpg 397 × 497; 31 KB
-
 Data-flow2.jpg 567 × 996; 108 KB
-
 Data-flow3.jpg 628 × 395; 60 KB
-
 DataFlowDiagram Esempio1.png 478 × 77; 3 KB
-
 DataFlowDiagram Example.png 478 × 77; 2 KB
-
 DataFlowDiagram Notation.png 169 × 247; 4 KB
-
 Dataflowexpr.png 194 × 333; 11 KB
-
 Dataflowfiringnodes.png 413 × 269; 16 KB
-
 Dataflowiterstructure.png 1,020 × 668; 8 KB
-
 Dataflowmanchester.png 927 × 618; 11 KB
-
 Dataflownode.png 1,020 × 720; 18 KB
-
 Dataflowsimplestructure.png 958 × 541; 8 KB
-
 Dataflowwhileloop.png 442 × 434; 18 KB
-
 Datastore16654654654564654.JPG 80 × 36; 1 KB
-
 Datastore265465465465456.JPG 750 × 201; 16 KB
-
 DFD shapes.png 116 × 270; 2 KB
-
 DFD-Gane-Sarson-Notation.png 300 × 279; 6 KB
-
 DFD-Materialni toky.PNG 334 × 225; 4 KB
-
 DFD-Yourdon-Notation.PNG 300 × 279; 6 KB
-
 Dfd.JPG 311 × 159; 7 KB
-
 DFD0.png 852 × 704; 11 KB
-
 DFD1.png 1,189 × 314; 6 KB
-
 DFDC.png 856 × 157; 4 KB
-
 Eprint enterprise (iphone-android).png 1,514 × 1,075; 41 KB
-
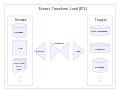 Extract, Transform, Load Data Flow Diagram.svg 990 × 765; 41 KB
-
 FBP - functional processes.png 718 × 416; 4 KB
-
 FBP - interactive app schematic.png 762 × 432; 15 KB
-
 FBP - interactive app schematic2.png 477 × 290; 406 KB
-
 FBP - multiplexing diagram.png 902 × 394; 7 KB
-
 FBP - Simple network.png 462 × 298; 3 KB
-
 FBP - Standard Update.png 738 × 268; 10 KB
-
 FBP- Telegram problem.png 638 × 128; 3 KB
-
 FFT Butterfly radix8.svg 420 × 500; 16 KB
-
 Fig2.png 765 × 713; 51 KB
-
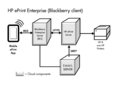 Figure 4. ePrint data flow for Blackberry devices..png 1,514 × 1,075; 40 KB
-
 Flow chart of meal ideas.png 1,421 × 951; 841 KB
-

-
 Fo2ufg823rhf832hfdorfg.JPG 642 × 862; 44 KB
-
 Gane.png 281 × 206; 5 KB
-
 Ifdataflow.png 356 × 525; 21 KB
-
 Image007pipe.png 675 × 42; 634 bytes
-
 Image014pipe.gif 420 × 41; 3 KB
-
 Infographic on the flow of Wikidata (for offWiki usage).svg 745 × 1,053; 824 KB
-
 Infographic on the flow of Wikidata (for onWiki usage).svg 745 × 1,053; 812 KB
-
 Kraken flow diagram-2.png 1,508 × 1,002; 184 KB
-
 La metafora del reloj.png 662 × 559; 22 KB
-
 Mergedataflownode.png 233 × 188; 7 KB
-
 Multi-channel-app-grafik.JPG 1,059 × 762; 84 KB
-
 MWM-Primo Datenfluss 2006.jpg 3,303 × 2,350; 497 KB
-
 Olsr-overview.pdf 2,070 × 1,168; 15 KB
-
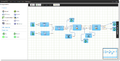 Onlinehpc-screenshot.png 1,618 × 827; 140 KB
-
 Phlogiston Architecture.png 1,440 × 1,109; 103 KB
-
 Proces4564564564.JPG 80 × 57; 1 KB
-
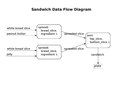 Sandwich data flow diagram.pdf 1,650 × 1,272; 22 KB
-
 Singledataflownode.png 186 × 271; 9 KB
-
 Status Flag Parameter.png 222 × 218; 7 KB
-
 Switchdataflownode.png 233 × 188; 7 KB
-
 Telemetry-data flow chart.jpg 1,747 × 1,366; 255 KB
-
 Tracking-data flow chart.jpg 1,785 × 1,276; 274 KB
-
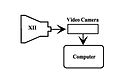 XiiVideo.jpg 419 × 291; 23 KB
-
 Yourdon.PNG 281 × 220; 5 KB
-
 Схемка.JPG 971 × 903; 105 KB
-
 Формула 9.jpg 698 × 104; 8 KB


_(Case_3).png)
_Tele-Communication_Companies_merging.png)


.png)


.svg)
.svg)


