Category:Demographic charts of the City of Manchester
Jump to navigation
Jump to search
Media in category "Demographic charts of the City of Manchester"
The following 16 files are in this category, out of 16 total.
-
 Manchester ethnic demography over time.gif 1,200 × 1,097; 466 KB
-
 Manchester population pyramid 1861.svg 2,810 × 2,165; 17 KB
-
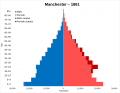
 Manchester population pyramid 1881.svg 2,810 × 2,165; 17 KB
-
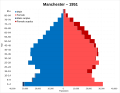
 Manchester population pyramid 1891.svg 2,811 × 2,167; 17 KB
-
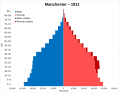 Manchester population pyramid 1911.svg 2,810 × 2,165; 18 KB
-
 Manchester population pyramid 1931.svg 2,810 × 2,165; 18 KB
-
 Manchester population pyramid 1951.svg 2,811 × 2,167; 17 KB
-
 Manchester population pyramid 1961.svg 2,810 × 2,165; 17 KB
-
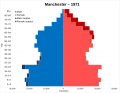 Manchester population pyramid 1971.svg 2,810 × 2,167; 17 KB
-
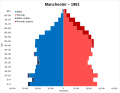
 Manchester population pyramid 1981.svg 2,810 × 2,165; 17 KB
-
 Manchester population pyramid 1991.svg 3,189 × 2,586; 25 KB
-
 Manchester population pyramid 2001.svg 3,190 × 2,541; 26 KB
-
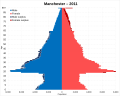 Manchester population pyramid 2011.svg 3,190 × 2,541; 26 KB
-
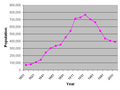 Manchesterpopulation.png 617 × 462; 5 KB
-
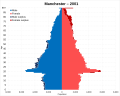
 Population pyramid of Manchester by ethnicity in 2021.svg 3,246 × 2,578; 93 KB
-
 UK and foreign born population pyramid of Manchester in 2021.svg 2,582 × 2,078; 47 KB


